|
Saturn NED drift charts 2010/2011 by Joerg Mosch
|
I had used Saturn images from your web page for measuring the drift of the NED
in 2010/2011. The results are ready now and I send it to you for publishing on
your Saturn pages.
Best regards and clear skies
Northern Electrostatic Disturbance: Around Saturn in 130 days
by Joerg Mosch, Meissen, Germany
Saturn’s 2010/2011 visibility surprised the observers with the most intensive electrostatic disturbance for decades.
It broke out in the Northern Temperate Zone (NTZ) on 2010 December 5. During the following weeks the NED produced
serpentine ridges expanding in retrograde direction. Therefore some people called it “Dragon Storm”.
To determine the movement of the storm within the Saturn atmosphere, the author has measured more than 280 videographs
using WinJUPOS 9.1.5. The pictures were taken by observers from all over the world, in most cases collected by ALPO.
Because of the changing shape of the NED’s origin, its prograde end was chosen as the point of reference.
The first result of the measurements was a longitude drift chart (fig. 1).
It shows a nearly linear NED movement against System III. To explain the variation of the drift, the longitude data
were transformed into the modified rotational system L’ using formula (1):
L' = Lx - ( Lx(T0) + Drift_Lx * (T - T0) ) (1)
with: L‘ longitude in modified rotational system
L observed longitude
x base system (rotational system) x
L(T0) mean longitude at time T0 (= base date)
Drift_Lx mean longitude drift
T time of observation
T0 base date
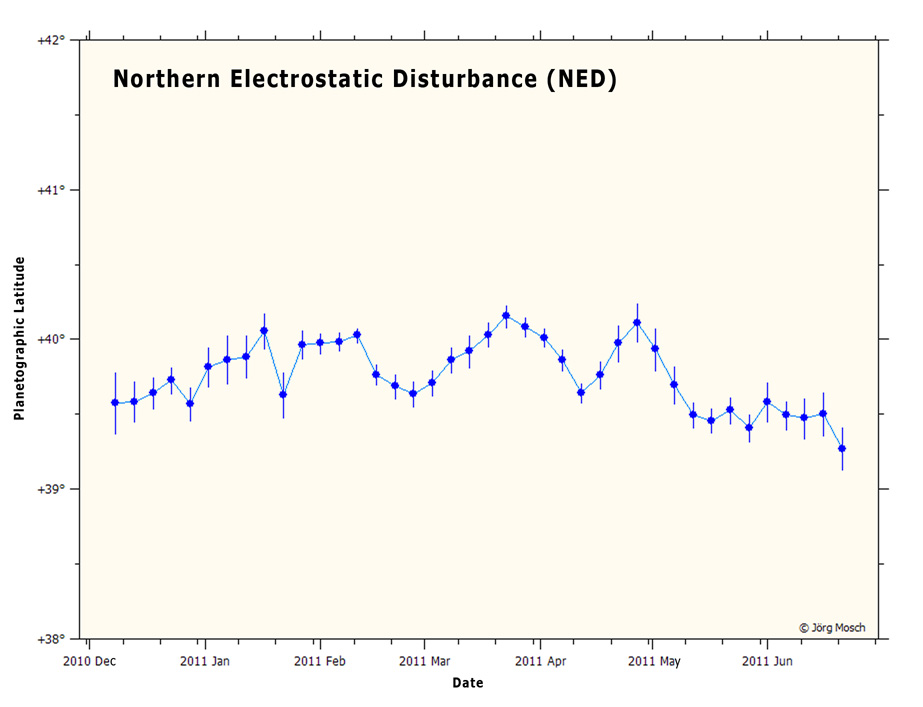
In addition moving averages were computed for an equidistance of five days and an interval of ten days.
The result can be seen in figure 2.
Moving averages of the latitude data illustrate, that there was also a small but significant oscillation in latitude (figure 3).
Comparing figures 2 and 3, it seems that there is no correlation between drift variations in longitude and latitude.
The storm center has passed the zero meridian twice: For the first time on January 14 and for a second time on May 24.
This implies a mean longitude drift of 2.8° per day. In other words: The storm center went around Saturn once in 130 days.
The length of its way at the 40° line of latitude was approximately 290.000 kilometers.
That means the storm center has moved with nearly 100 Kilometers per hour against System III.
Already some weeks before the planet’s opposition on 2011 April 04 it became difficult to identify the storm’s origin.
Due to the NED expansion there was an increasing number of white ovals and spots in the NTZ, at least around the whole
globe of the planet. In June the original storm center seams to fade and other spots in its neighborhood became more
prominent. Additionally the quality of the pictures decreased due to Saturn’s smaller elongation to the sun.
In comparison to the measurement of Jupiter, that of Saturn has a great advantage. The ring system gives a valuable help
in determining the equator of the planet. This allows accurate latitude measuring.
From the viewpoint of accuracy the most critical information is the time of a videograph. Due to the fast rotation
of Saturn, a single minute causes a longitude change of round about 0,6°. Using monochrome cameras with filter wheels,
most observers need total frame grabbing times between three and six minutes. The time information they give with
their L-RGB pictures is usually the average time of the L or R channel, because these delivers the main detail information.
If there was a choice, the author had preferred to measure single L, R ore IR pictures because of their smaller
exposure time interval.
In some cases a further source of inaccuracy seems to be the clock of the PC operating system used for the videography.
Even an error of a few minutes reduces the quality of the drift charts. That’s why it is essential to synchronize this
clock before every observation and to verify the correct conversion from local time to UT.
The pictures were taken by the following planetary observers: T. Akutsu (Japan), David Arditti (Great Britain),
Wolfgang Bischof (Germany), Dave and Gail Bleser (USA), Marc Delcroix (France), Torsten Edelmann (Germany), Christian
Fattinnanzi (Italy), Jan Fremerey (Germany), Antonio Garbelini (Brazil), Carmine Gargiulo (Italy),
Christopher Go (Philippines), Pietro de Gregorio (Italy), Marco Guidi (Italy), Torsten Hansen (Germany), Toshio Hayashi (Japan),
Chen Hsuan-Hsiao (Taiwan), T. Ikemura (Japan), Javier Beltran Jovani (Spain), A. Kazemoto (Japan), Willem Kivits (Netherlands),
Dimitris Kolovos (Greece), Tokojiro Kozawa (Japan), Teruaki Kumamori (Japan),Antoni Lasala (Spain), Jim Melka (USA),
Frank J. Melillo (USA), Miyakojima (Japan), Joerg Mosch (Germany), S. Ota (Japan), D. Parker (USA), Damian Peach (Great Britain),
Jim Phillips (USA), Jean-Jacques Poupeau (France), Pavel Presnyakov (Ukraine), Dennis Put (Netherlands),
Efrain Morales Rivera (Puerto Rico), Sadegh, Gh. (Iran), Jesus R. Sanchez (Spain), Matic Smecar,
Jazek Kos and Maru?ka Mole (Slovenija), M. Sugimoto (Japan), John Sussenbach (Netherlands), George Tarsudis (Greece),
Camilo Furnega Ucha (Spain), Freddy Willems (USA), Bruce Worsley (USA), A. Yamazaki (Japan),
Tomojuki Yoshida (Japan) and Kenkichi Yunoki (Japan). ? Thanks to all of them.
References:
[1] www.alpo-j.asahikawa-med.ac.jp/indexE.htm, last access 2011 July 13
[2] www.jupos.org, last access 2011 May 12
Figure 1: Longitude drift chart of the NED during Saturn’s visibility 2010/2011 based on WinJUPOS measuring of about
280 Saturn pictures.
Figure 2: Moving averages of longitude date in modified rotational system L? shows the variation of drift.
Figure 3: Moving averages of latitude date illustrate a small but significant oscillation in latitude.
Original report(rtf)
Figure 1: Longitude drift chart of the NED during Saturn’s visibility 2010/2011 based on WinJUPOS measuring of about 280 Saturn pictures.
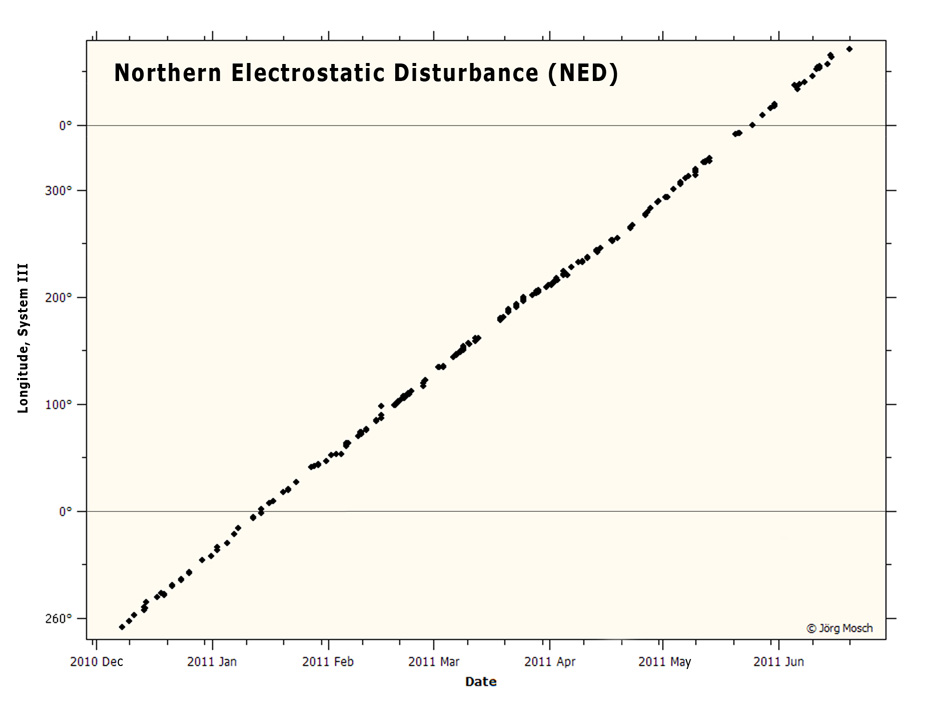 Figure 2: Moving averages of longitude date in modified rotational system L? shows the variation of drift.
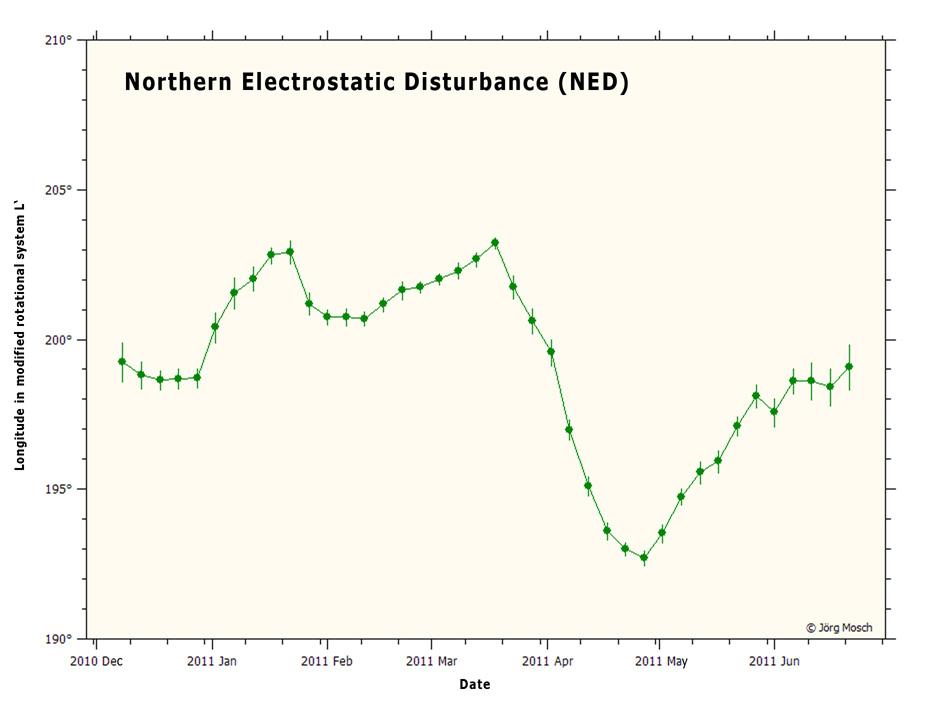 Figure 3: Moving averages of latitude date illustrate a small but significant oscillation in latitude.
 [Joerg Mosch Meissen Germany]
 ALPO-Japan Latest Saturn Section ALPO-Japan Latest Saturn Section
|