Jupiter in 2012/13: Interim report no.9 (2013 Jan.):
Interim report on Jupiter, 2012 Aug.-Dec.

January 21, 2013
John Rogers (British Astronomical Association),
including results from the JUPOS team

(Gianluigi Adamoli, Michel Jacquesson, Marco Vedovato, Hans-Joerg Mettig & Grischa Hahn)
Japanese (translated by Yuichi Iga)
Summary

This report covers Jupiter from 2012 Aug. to Dec., and follows on from our previous reports nos.3 and 6 [refs.1 & 2]. During this period, the planet’s appearance has become more normal after the drama of the NEB and NTB Revivals, but there is still much complex activity in those regions, and reddish colour is still widespread across the NTB(S), NEB, and parts of EZ. The NNTB is still absent but we are able to trace the long-lived ovals in the NNTZ, whose recent history is summarised in Appendix 1. The conjunction of the increasingly red GRS with the very red oval BA has also produced a striking appearance.

Along with this report are six Appendices giving further details:

Appendix 1: NNTZ: Anticyclonic ovals, 2008-2012 (Gianluigi Adamoli & John Rogers)
Appendix 2: NEBn: Dynamic interactions of spots
Appendix 3: Equatorial Band: Tracking the f. end
Appendix 4: SEBn: A new South Equatorial Disturbance?
Appendix 5: Zonal wind profiles (Grischa Hahn)
Appendix 6: Fireballs on Jupiter (Dr Ricardo Hueso)


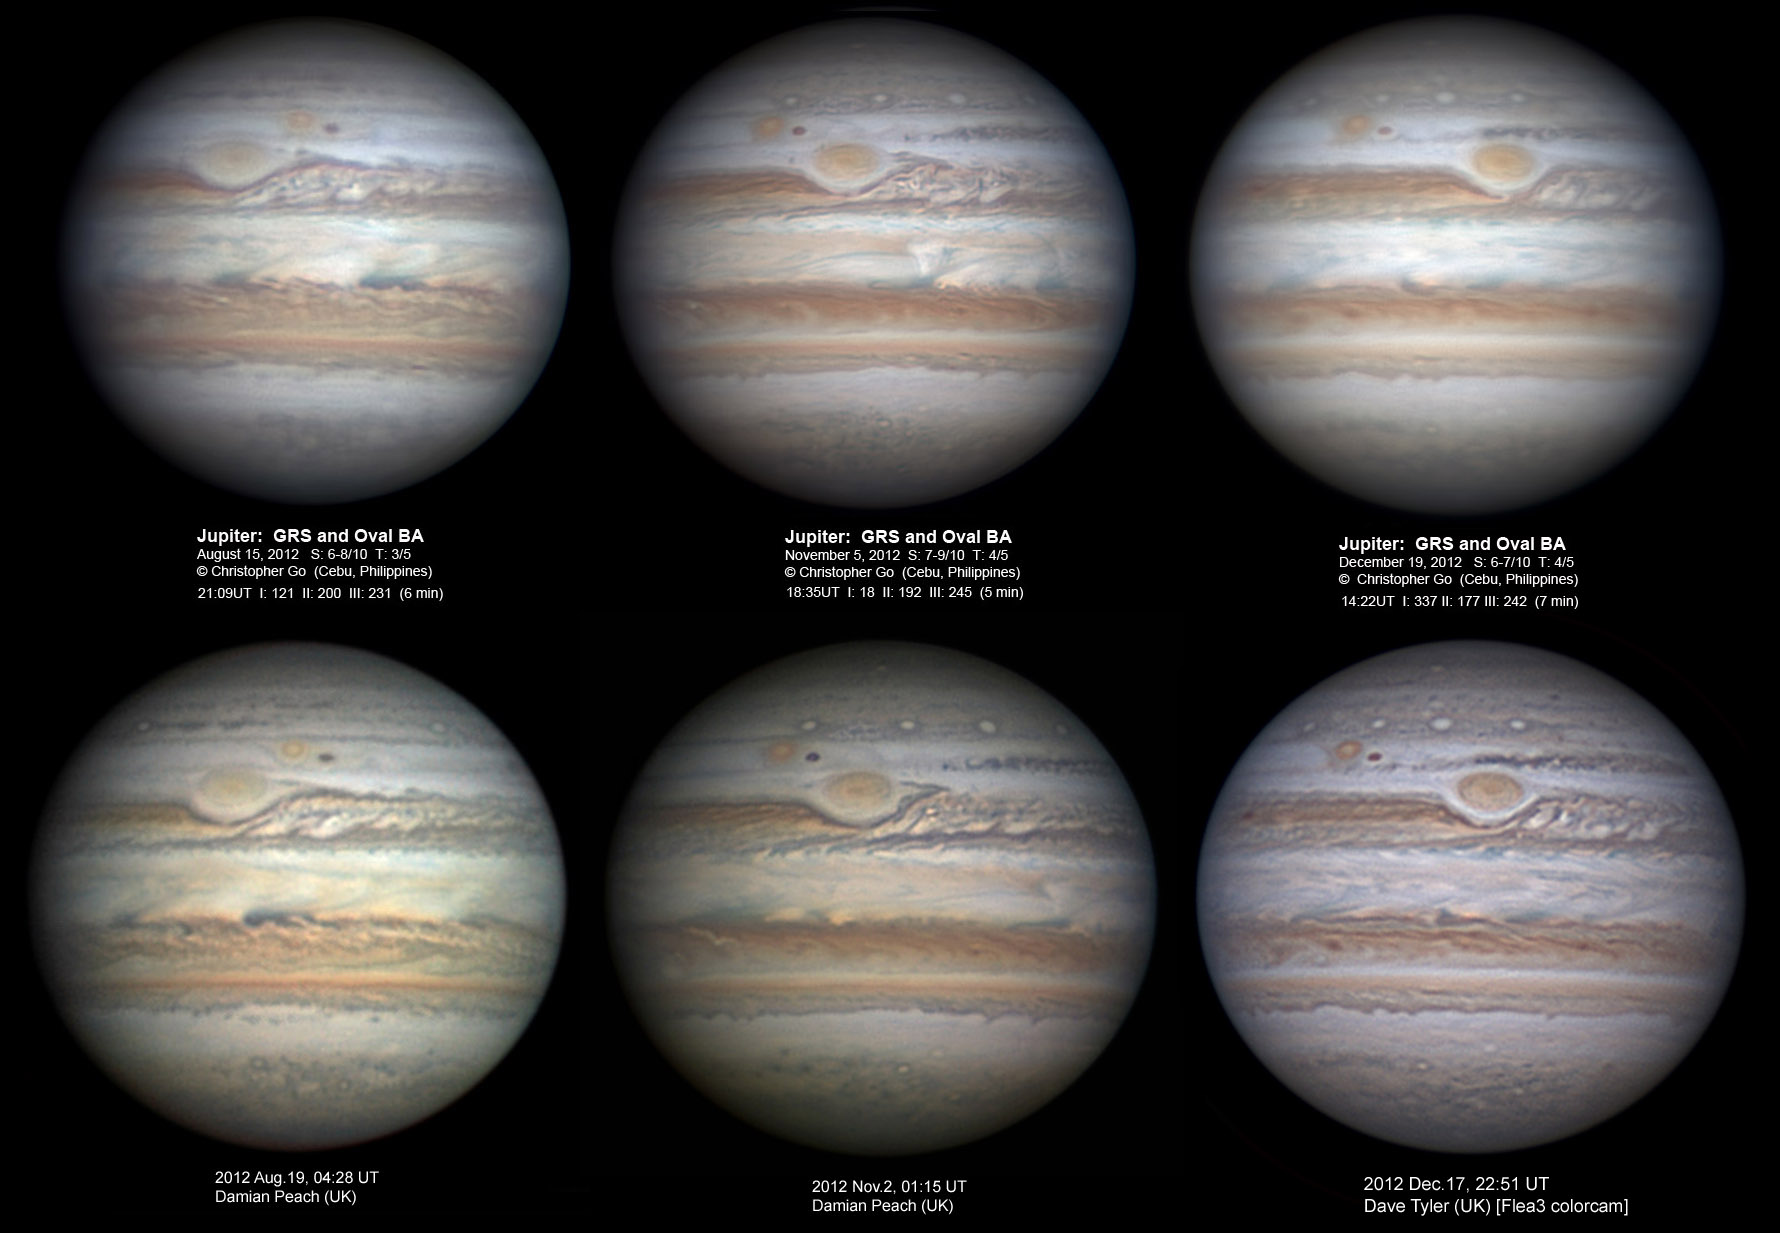
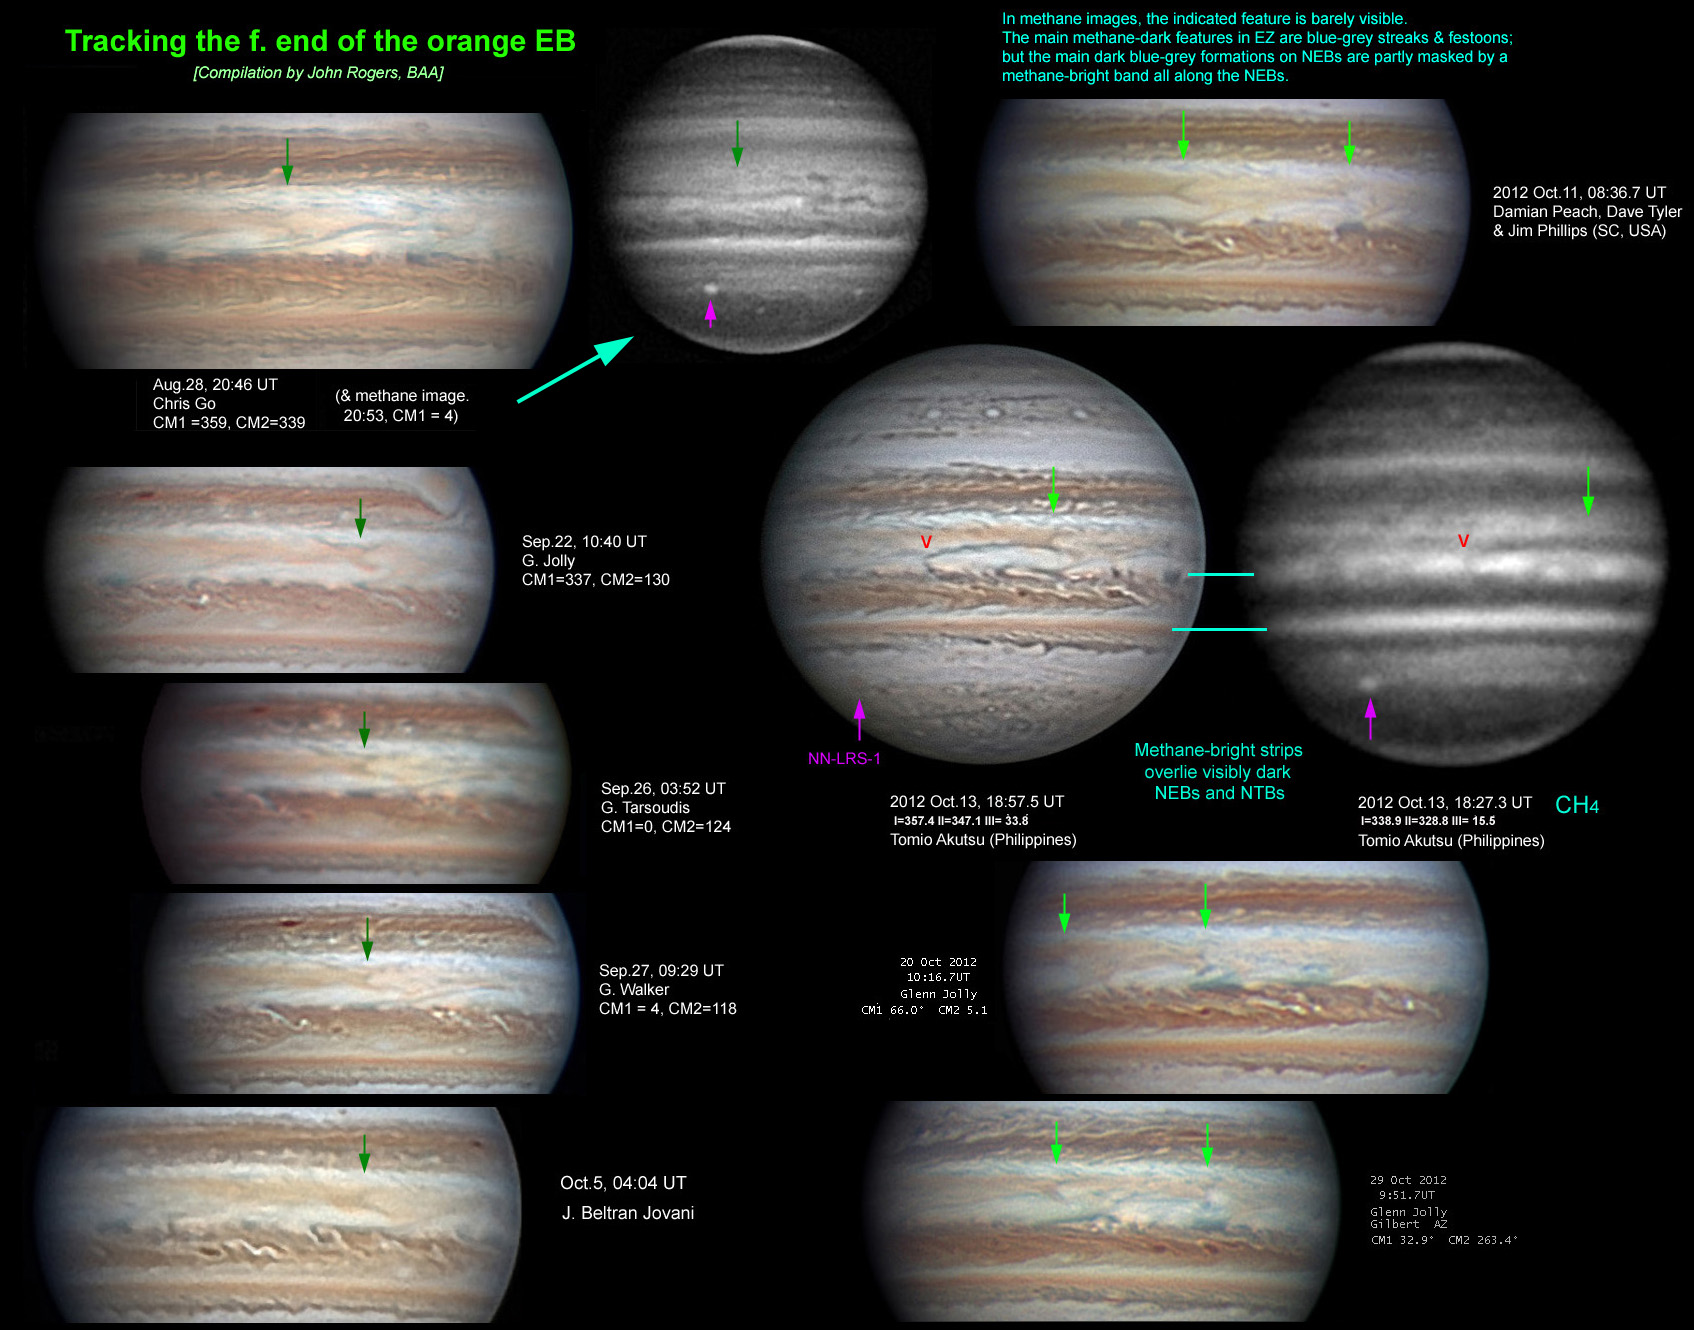
Methods

Thanks are due to all the observers, who have produced a huge number of excellent images throughout the apparition, often in spite of difficult weather conditions. Unfortunately, space prevents us from showing relevant images from all observers - sometimes several hi-res image sets are produced at the same time - but all are appreciated. Thanks too to those who have commented on various interesting phenomena during the apparition, especially Chris Go, Christophe Pellier, Manos Kardasis, Gianluigi Adamoli, and Michel Jacquesson.

Much of the activity this apparition - such as the ongoing turmoil in the NEB, and the subtly shifting streaks and shadings in the EZ - would be best appreciated if the images could be compiled into hi-res map animations. However, this would require a great deal of careful work, made difficult by the varying resolution and colour balance of the different images, and by the distribution of observers in longitude which means that a given region is commonly imaged well on three successive rotations but not on the next two.

Grischa Hahn has produced zonal wind profiles from sets of images in Sep., Nov., and Dec., as shown in Appendix 5. All the jets are well defined, even those which carry no visible spots at present. In general, these are all very similar to previous profiles from spacecraft, confirming that the NEB and NTB Revivals have not altered the zonal wind profiles.

As usual, all images and maps are presented with south up. Speeds of spots are measured from the JUPOS charts and quoted as DL2 (degrees of System II longitude per 30 days), unless otherwise specified. All JUPOS charts show bright spots as red and dark spots as black.

Overall appearance

There have been progressive colour changes over the months (Fig.1). The GRS, NEB, and oval BA, have all darkened and reddened. Much of the NEB seems to have become darker and redder as the turbulence of the Revival subsided, at least in regions which are not affected by new rifts; but its northern edge is grey and becoming lighter. In contrast the NTB(S), dark and strongly orange in August after the Revival, is gradually fading.

The major zones on the planet also have rather different colours. The NTropZ is still very narrow, but its early ochre shading has brightened to white. The EZ has a broad ochre EB at some longitudes, though this too has become paler since the summer. The NTZ-NNTZ comprise a single broad white zone, the NNTB being absent. And the STropZ-STZ, at many longitude where the STB is tenuous, also comprise a broad white zone - but bluer than other zones, and indeed, distinctly blue in some images in Nov-Dec. As we do not have an absolute standard of colour on Jupiter, it is possible that the STropZ-STZ is truly white, and all other zones, including the NTZ-NNTZ, are reddish to some extent.

Selected images in methane-band and ultraviolet filters can be seen in Figs.4, 10 &.12, and some other methane-band images are in the Appendices.

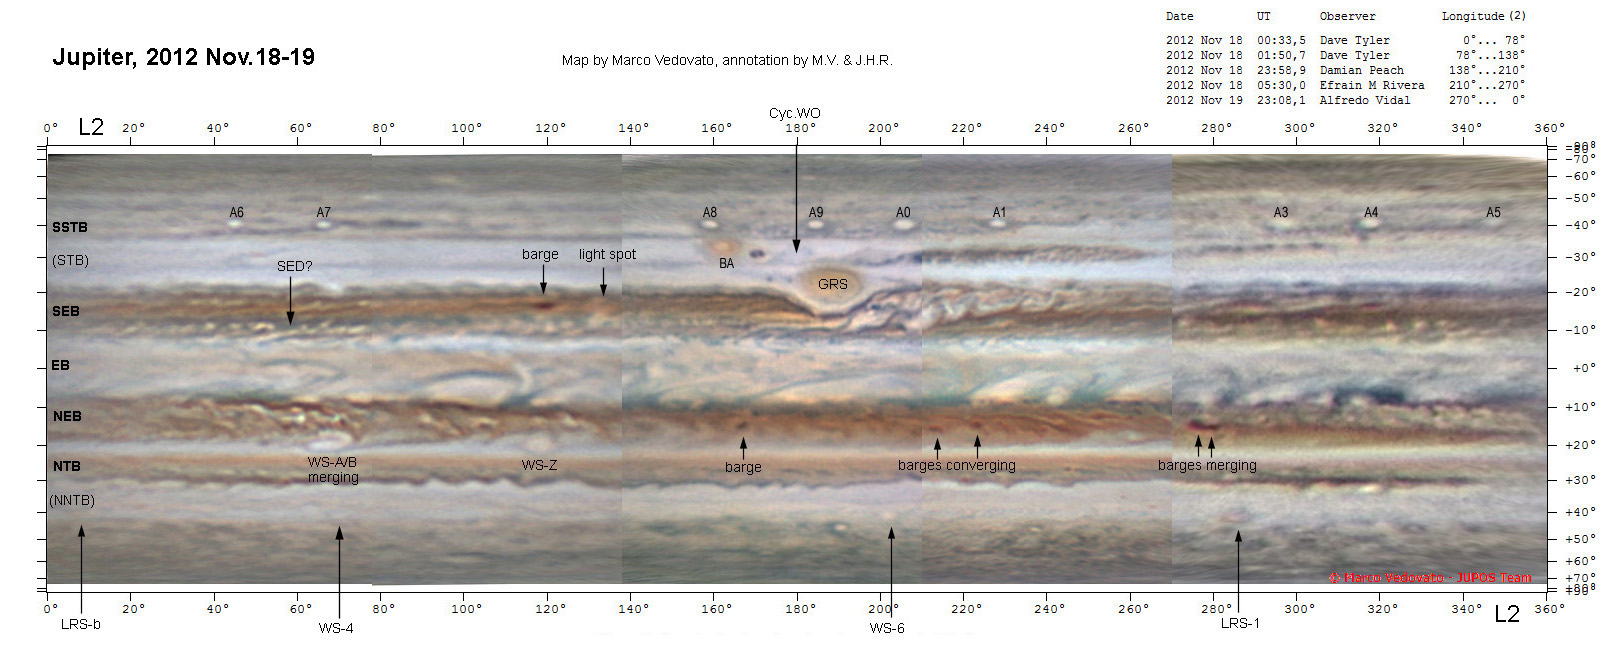
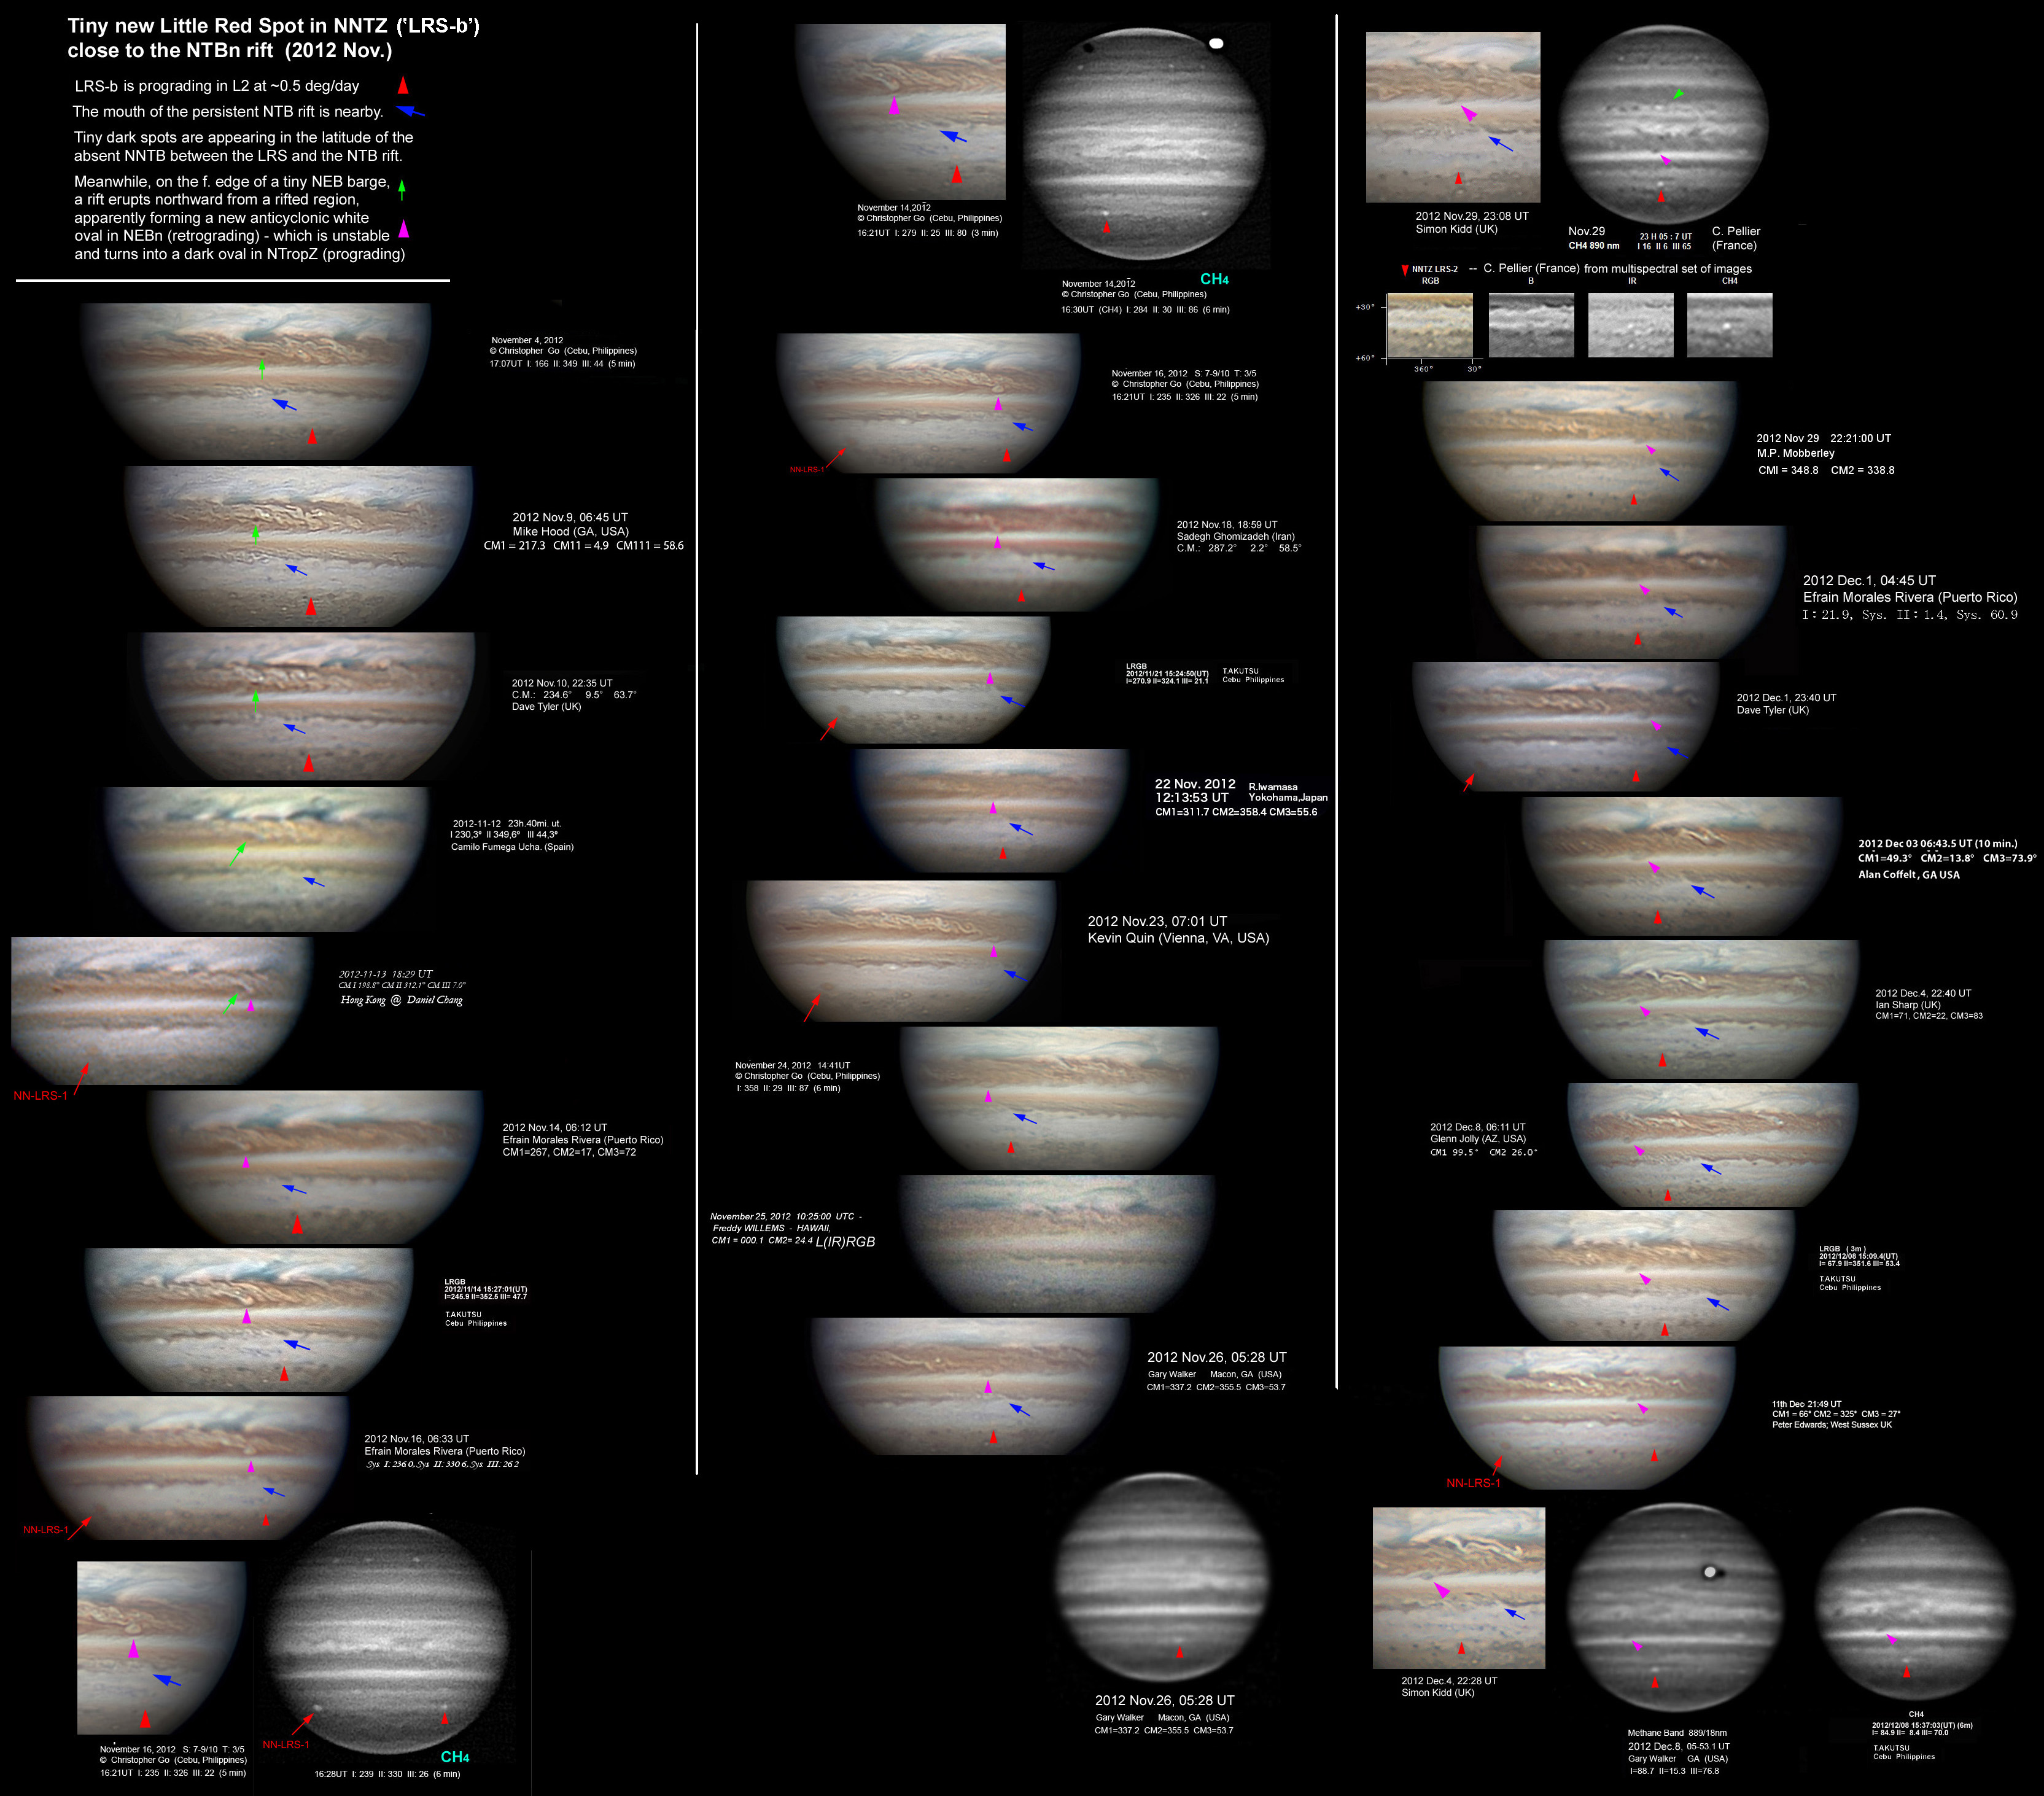
A complete map in the methane band, with a report, has been posted by Manos Kardasis at:
http://kardasis.weebly.com/jupiter-2012-13.html

N.N.Temperate Region

The NNTB, and the NNTBs jetstream spots, were wiped out during the NTB outbreak, and they are still absent; the whole N.N.Temp. region appears merged with the NTZ in a single broad white zone. Only faint minor streaks, and a few small faint jetstream spots, have been detected in the NNTB latitudes, and they have been transient.

One spot however is distinct: NN-LRS-1, the often-reddish anticyclonic oval which has existed at least since 1993 [ref.3]. This apparition it has strong red colour and a notably dark rim. It appeared similar while the NNTB was temporarily whitened in 2009, just as the GRS tends to become darker and redder when the SEB is whitened.

A second Little Red Spot has also been detected in the NNTZ, mainly because it is bright in methane images. As we do not know whether it will persist for long, we give it a temporary designation of ‘LRS-b’. In visible light it is very small and often almost invisible, but in favourable images, it appears a luminous pale pink colour. The colour seems to be sensitive to the filters or channels used, as it can hardly be seen at all in some observers’ hi-res images. G. Adamoli and C. Pellier have tracked this back as a tiny white spot in summer, 2012, and probably earlier. See Appendix 1 for the history, JUPOS chart, and image gallery of this and other anticyclonic ovals in the NNTZ. (Apart from LRS-1 and LRS-b, there are two other weakly methane-bright spots in this latitude, which are small white ovals tracked from previous apparitions.)

N. Temperate Region

The revived NTB is still a broad dark double belt. The S component is featureless, strongly reddish, and gradually fading. The N component is dark grey and notably wavy, as it was in 2008 after the previous NTB outbreak. The two components are separated by a narrow strip which, at the highest resolution, consists of innumerable tiny white spots. These are particularly evident in one sector where they comprise a turbulent rift opening through the NTBn edge [Fig.4] - sometimes generating miniature outbreaks (e.g. as noted by Chris Go on Sep.15).

The drifts of features on NTBn, according to the JUPOS data, are quite diverse but all within the normal range of the N. Temperate Current (Fig.5). The rift has DL2 ~ +16 deg/month; so do several features p. it, including an unusually bright white oval in NTZ (which is also bright in methane images). Further p., most features have DL2 ~ +22 (+/-3) deg/month; while f. the rift, where the waviness is most pronounced, most features have DL2 = +30 deg/month. However, tracks with different speeds are interspersed, as in 2008-2009 [refs.4 & 5], and more study would be needed to determine the dynamics of these patterns. (Grischa Hahn’s zonal wind profiles show a well-defined gradient across the NTB latitudes; see Appendix 5.)

One spot f. the rift moved with the NTBn jet at DL2 = +69 deg/month, so it is likely that the rift is disturbing this retrograding jet. Given what we observed in 2008-2009 [refs.4 & 5], it would not be surprising if within the next year or so, these phenomena were to develop into a N.Temperate Disturbance spanning the NTZ.

The NTB(S) is orange and featureless and gradually fading. It is only methane-bright on its S edge [see Fig.10].

N. Tropical Region

As the turbulence of the NTB and NEB Revivals has subsided, the NEB and NTropZ have gradually reverted to a more normal appearance [Figs.1 & 3]. Much of the NEB seems to have become darker and redder, at least in regions which are not affected by new rifts; but its northern edge is grey and becoming lighter, as the broadened belt starts to recede southwards again. Also the NTropZ, formerly veiled in pale ochre shading, has become lighter and is now white. However the present state cannot be called quiescence, because the rift activity in the NEB has developed impressively since it started in late August, and the developing barges and ovals in the NEBn are still unstable with several mergers and other interactions observed.

These barges and ovals are charted in Fig.6. This extends the chart in our earlier report [ref.1], which showed the origin of 3 AWOs (red points), which have undergone successive mergers to form white spot A (now DL2 = -22 deg/mth) as well as the long-lived white spot Z (DL2 = -42 in Oct-Nov., probably faster than ever before, and DL2 = -38 in Nov-Dec.). The chart indicates that as many as 10 small dark brown barges have also developed, but several have undergone mergers or been disrupted by rifts, leaving only about 4 now.

Appendix 2 (Figs.N1 to N5) presents detailed alignments of images in five longitude sectors, to show these interactions of spots in the NEBn. Well-observed mergers of a pair of AWOs and of a pair of barges show the same characteristics as similar mergers which we have observed in this latitude in previous years. Mergers of barges are quite common; we reported three examples in a paper in Icarus (2006) [ref.6], and have observed at least 6 examples since then[see refs. in Appendix 2]. Mergers of AWOs were not clearly observed until 2006, but we have recorded 6 since then, some in detail [Appendix 2]. Unlike mergers of AWOs in other latitudes [ref.6], those on NEBn usually appear to be incomplete, with a white cloud or fragment of one oval emerging Sf. the other with slower drift, although it usually disappears soon after.

Meanwhile, the NEB north edge is already becoming lighter and disrupted; long sectors have become pale grey and there are ligher patches intruding onto it. So the expansion following the Revival already appears to be receding, suggesting that another cycle of narrowing and Revival could follow within a 3-year period.

NEB rifts
New rift activity appeared in the NEB in late August, with the appearance of several strikingly bright spots which then expanded as rifts, as shown in our previous report no.6 [ref.2]. The JUPOS chart [Fig.7] and maps [Fig.3] show how this activity has proliferated and extended around the NEB, occupying about half its circumference. Five or six rifted regions have appeared, starting as tiny brilliant white spots and expanding as usual. The rifted regions have DL2 ~ -2.0 to -1.75 deg/day, while rifts within them have DL2 ~ -3.7 to -2.7 deg/day.

Equatorial Region

NEBs dark projections
Since August, there has been a fairly stable array of typical large dark blue-grey projections or plateaux around the NEBs: see the JUPOS chart [Fig.8] and maps [Fig.9]. There were 13 in August, diminishing to 10 or 11 in Nov-Dec. Most of them have DL1 = +6 to +16 deg/mth (mean, +9 deg/mth), whereas a few more closely spaced ones have DL1 = -4 to -5 deg/mth.

Equatorial Zone
The EZ is largely whitish but is filled with a complex mixture of festoons, tenuous blue-grey streaks, and diffuse ochre bands, including an irregular ochre Equatorial Band (EB). In August this EB extended from L1 ~ 250 to 355, but its extent and colour have gradually diminished during the autumn [Fig.9], especially in its p. part, so by Dec. only short segments were really notable, although traces of ochre colour remained at many longitudes.
This ochre or orange EB has been one of the most interesting features of this apparition, so to investigate it further I assembled a lot of images of its f. end, which was the most well-defined part of it, from Aug.21 to Nov.10. Selected hi-res images are in Fig.10 and the complete set (plus more methane images) in Appendix 3. The result was not very informative, as no particular motions or trends could be seen associated with the orange colour. The f. end appeared to be an irregular whitish cloud stably positioned south of a NEBs projection - a typical location for such clouds, although this one was unusually conspicuous. It showed rapid short-term changes in shape, but no overall motion, even while the adjacent NEBs projection interacted strongly with passing rifts in the NEB (from Sep.11 until late Oct.; see images in Appendix 3).
A second f. end of the EB was visible in Oct. ~40 deg. further f. This too was formed by a very bright and dynamic white cloud lying south of a NEBs dark projection and festoon, probably associated with it, but broke up in early Nov. Other such features could sometimes be seen at other longitudes.
In methane-band images, the f. end of the orange EB was barely visible. The main methane-dark features in the EZ were the blue-grey streaks and festoons, whereas the main dark blue-grey projections on NEBs were partly masked by a methane-bright band along the NEBs(Fig.10). By Nov., there was a continuous methane-dark EB, unrelated to the visible coloured streaks (Appendix 3).

SEBn: A new SED?
Large numbers of chevrons are seen around the SEBn in hi-res images, as usual. There is strong evidence that a new S. Equatorial Disturbance (SED) is forming (Appendix 4).
The main evidence for a new SED is from the JUPOS chart. Since 2012 Aug. it has shown the familiar dynamical signature of a SED, that is, a band of low spot density, moving with positive DL1, which represents the SED itself, and a gradient of speed for the chevrons, whose speed increases eastward from the SED. However, images do not consistently show the characteristic form of a SED, although suggestive features repeatedly appear in the relevant longitudes. I propose that there is an incipient SED, ‘struggling to be born’, and that it will develop into a classical SED over the coming months.

S. Tropical region

The SEB shows the usual vigorous rifting (bright convective disturbances) f. the GRS.

There are two conspicuous spots in mid-SEB: a very dark barge and an irregular light spot (Figs.2 & 3). They were respectively at L2 = 83 and 107 on Aug.1, and L2 = 124 and 137 on Dec.10. The light spot has been mysterious; it is quite large, cream-coloured, stable (it has existed since 2011 July), but lacks the usual oval form of a circulation. However, an oval outline within it can be seen in v-hi-res images by HST on Sep.20 [ref.10], and by the Thai National Obs. on Dec.28 (S. Poshyachinda, TNO & NARIT) (thanks to Chris Go for forwarding both these images). This indicates that it is indeed a cyclonic circulation, similar to the dark barge, but filled with bright cloud, which also extends irregularly on the north side. The barge and the light spot have been converging intermittently. They have been just 13 deg. apart (centre to centre) throughout Dec. Any closer interaction would be interesting to watch.

The SEBs edge proper, at 19-20 deg.S, is not greatly disturbed, and only two spots have been tracked in the retrograding jetstream: one with DL2 = +159 in Sep. (possibly the fastest retrograding speed ever recorded), and one with DL2 = +120 deg/mth in Dec. However, zonal wind profiles (see below) indicate that the jetstream is still present, just not marked by distinct spots.

Immediately to the S, at 22 deg.S, grey streaks form an extra band (‘SEB(SS)’?) at all longitudes. The JUPOS chart shows a wide range of speeds for these grey streaks, ranging from DL2 = 0 to +54 deg/mth, but mostly clustering around +10 to +18 deg/mth.
(These streaks are further north than the earlier S.Trop.Band, which was huge in 2011, and still present though thinner in 2012 July. Its f. end prograded from L2 = 140 in mid-July to 90 in early August, then it faded away completely during August.)

The GRS (Figs.1 & 12) is at L2 = 187 on Dec.1, with DL2 = +1.2 deg/mth maintained since mid-2011, and the 90-day oscillation is clearly shown in the JUPOS chart as usual. It appears to have gradually become darker and redder during the apparition, after being very pale at the start. There were tenuous dark streaks around its S side in Aug-Sep., but these had disappeared by Dec. leaving the GRS as an isolated orange oval.

S. Temperate region

As usual, the STB is no more than a very tenuous STB(N) at most longitudes, but it has several sectors with substantial features (Figs.2, 11, 12). These are as follows.

1) Oval BA (Fig.12). This had regained quite strong orange colour at the start of the apparition, which has intensified even further since then; it is now as strongly red as anything gets on Jupiter, even more so than the GRS. Christophe Pellier and Damian Peach report (in 2013 Jan.) that the orange colour is easily seen visually at the eyepiece, even with 10 inches aperture. As always, the colour is in an annulus with a pale core. Oval BA passed the GRS on Sep.17. It had DL2 = -12 deg/mth before then, and -10 deg/mth after.

2) F. oval BA there is an unusual pair of quite stable cyclonic ovals (Fig.12). The first, on the f. edge of oval BA, is a small, extremely dark spot with a white collar. (Observers have noted its darkness weakening in recent weeks.) The second, 13 deg. f. the dark spot in Sep-Oct. but only 10 deg. f. in Nov-Dec after it passed the GRS, is a white oval, bordered by variable faint blue-grey streaks. Both must be cyclonic as they are at lower latitude than BA, and methane-dark (Fig.12). Surprisingly, the white space of STZ between them is not an anticyclonic oval (not distinctly methane-bright), although there is usually a small AWO in this position.

3) The only broad dark segment of STB is 60 deg. long and, with DL2 = -18 deg/mth, is rapidly converging on the cluster of ovals f. oval BA. Like many such STB segments (e.g. in the Cassini movies), it appears to be a turbulent cyclonic sector which emits small dark spots p. on the STB(N) (DL2 = -48 deg/mth for the best-defined one; they do not last beyond ~ 10-20 deg), and f. on the STB(S) (DL2 ~ 0 to +21 deg/mth; after tens of degrees, they end up in a southerly dark streak). Its p. end is now very close to the cyclonic white oval, so interaction could start at any time. Last time such an interaction happened, in 2010, it produced a remarkable outbreak of activity [ref.7].
These interactions, when a STB belt segment drifts up to the complex that includes oval BA, occur every few years, and a new STB feature always forms to fill in the gap that has opened up. Usually this is a cyclonic complex. This apparition, there is such a feature about 145 deg. f. the dark segment of STB:

4) A small dark spot which had appeared in 2011 August, and was remarkably dark in 2012 July and August, with DL2 = -16 deg/mth. It gradually faded from Aug. to Oct., and by late Nov. it had turned into a tiny, light pink spot, embedded in a faint grey oblique streak. Although it is now very faint, this may be the new cyclonic disturbance that will come to dominate this sector of the STB.

S.S. Temperate region

There are 9 stable AWOs at 40-41 deg.S, labelled in Figs.2 & 3 and Fig.13 [JUPOS chart]. Because this population has been traced continuously over many years while some appeared and disappeared, they are labelled A0 to A9 with no A2. The SSTB is replaced by a cyclonic white strip between A1 and A3.

Further S, the long-lived AWOs at ~50 deg.S and ~60 deg.S are still well tracked. They have variable speeds. The oval at ~60 S was virtually stationary at L2 = 95 from early Sep. to late Dec, while the oval at ~50 S halted due N of it from Oct.27 to Nov.8, although it rapidly prograded before and after.


References

[--to our previous reports, including interim reports on the BAA Jupiter Section web site, numbered]

1. [2012 No.3]. Progress of Jupiter's great northern upheaval, 2012 July-August.
http://www.britastro.org/jupiter/2012_13report03.htm

2. [2012 No.6]. Renewal of rift activity in the revived NEB: Image set of GRS hemisphere, 2012 Aug-Sep.
http://www.britastro.org/jupiter/2012_13report06.htm

3. Rogers JH, Adamoli G & Mettig H-J (2011) ‘Jupiter’s high-latitude storms: A Little Red Spot tracked through a jovian year.’ JBAA 121 (no.1), 19-29.

4. [2009 no.7] Jupiter in 2009: Interim Report, with new insights into the NTZ disturbance, NEB expansion, and SEB fading.
http://www.britastro.org/jupiter/2009report07.htm

5. [2009 no.8] Jupiter's North Temperate Region in 2009: The nature of the North Temperate Disturbance. (by G. Adamoli & J. Rogers)
http://www.britastro.org/jupiter/2009report08.htm

6. Rogers JH, Mettig H-J, Cidadao A, Sherrod PC, and Peach D (2006). ‘Merging circulations on Jupiter: observed differences between cyclonic and anticyclonic mergers.’ Icarus 185, 244-257. [http://www.britastro.org/jupiter/icarus.htm]

7. [2010 no.4] A triple collision of long lived circulations in the S. Temperate domain.
http://www.britastro.org/jupiter/2010report04.htm

8. [2012 no.5] Fireball on Jupiter, 2012 Sep.10.
http://www.britastro.org/jupiter/2012_13report05.htm

9. [2010 no.19] Some developments in Jupiter’s northern hemisphere
http://www.britastro.org/jupiter/2010report19.htm

10. Unpublished HST images on 2012 Sep.20, made by an international team headed by Dr Glenn Schneider (University of Arizona) and Dr Jay Pasachoff (Williams College and Caltech), as part of their attempt to detect the transit of Venus that was then visible from Jupiter. Their data reduction is under way. The SEB spot structure was pointed out by Christophe Pellier.


Figures


Click for the original size

Fig.1. Large-scale changes from Aug.to Dec. Two triplets of images: (top) all by Chris Go, (bottom) by Damian Peach and Dave Tyler. In these images which appear to have reasonably consistent colour balancing, one can see progressive changes over the months. The GRS and oval BA both become darker and redder. So does much of the NEB, as the turbulence of the Revival has subsided, at least in regions which are not affected by new rifts; but its northern edge is grey and becoming lighter. Also the NTropZ, formerly veiled in ochre shading, has become lighter and is now white. In contrast the NTB(S), dark and strongly orange in August after the Revival, is gradually fading.


Click for the original size

Fig.2. Map from images on 2012 Nov.18-19, labelled.


Click for the original size

Fig.3. Some of the best maps from 2012 Aug. to Dec., produced by Marco Vedovato or by the observers themselves, aligned in System II longitude.


Click for the original size

Fig.4. Set of images including LRS-b, the NTB rift, and a new NEBn spot forming. At top and bottom, some v-hi-res views and some methane-band images. (Also see Fig.12.)


Click for the original size

Fig.5. JUPOS chart of the NTBn. In all JUPOS charts, black points are dark spots, red points are bright spots.


Click for the original size

Fig.6. JUPOS chart of the NEBn/NTropZ. As previously reported [ref.1], at least some of the dark spots in the NTropZ in June (blue points, d4 to d9]) turned into AWOs (red points), which have undergone successive mergers to form white spot A (now DL2 = -22 deg/mth) as well as the long-lived white spot Z (DL2 = -42 in Oct-Nov., and DL2 = -38 in Nov-Dec.). Many very small barges have also developed (black points), with DL2 ranging from ~0 to -15 deg/mth, but several have undergone mergers or been disrupted by rifts, leaving only about 4 now.


Click for the original size

Fig.7. JUPOS chart of the mid-NEB rifts.


Click for the original size

Fig.8. JUPOS chart of theNEBs edge, showing the large dark ‘projections’ (black points and grey shaded areas; < > indicate p. and f. ends of dark features). The present array is fairly stable and normal, in contrast to the very dark retrograding spots which initiated the NEB Revival in 2012 March.


Click for the original size

Fig.9. Some of the best maps of the equatorial region from 2012 Aug. to Dec., produced by Marco Vedovato, aligned in System I longitude. On these maps one can trace the large dark NEBs ‘projections’, the orange EB, and the subtle pattern of streaks in the EZ. However, little can be seen of the putative new SED until Nov.


Click for the original size

Fig.10. The f. end of the orange EB (green arrow): selected hi-res and methane images.


Click for the original size

Fig.11. JUPOS chart of the S. Temperate region. Oval BA is marked in green.


Click for the original size

Fig.12. Multispectral sets showing the GRS side of the planet in 2012 Nov-Dec, including RGB, blue or UV, and methane-band (0.89 um) images. (At lower right, a set from the opposite side of the planet.) In some cases the unprocessed stacked methane image is also shown; note that the processing tends to produce artefacts such as dark bands adjacent to the methane-bright GRS and oval BA, and to enhance details which may have little real contrast. Methane-bright anticyclonic ovals in the S.Temp., N.Trop., & N.N.Temp. regions are marked, as well as the methane-dark cyclonic oval in the S.Temp. region. Convective plumes in the SEB f. the GRS are methane-bright on Nov.8 only. There are still methane-bright strips overlying the NEBs and NTBs. The NTropZ is still shaded in UV images but not in blue images. The EB is dark in both blue and UV, and in methane.


Click for the original size

Fig.13. JUPOS chart of the S. Temperate region, showing the 9 AWOs. (There have been no subtantial cyclonic features to track in this apparition.)

John Rogers (British Astronomical Association), 2013 Jan.


Jupiter in 2012/13: Interim report no.9


木星:中間レポート、2012年8月〜12月
Interim report on Jupiter, 2012 Aug.-Dec.

January 21, 2013
John Rogers (British Astronomical Association),
including results from the JUPOS team

(Gianluigi Adamoli, Michel Jacquesson, Marco Vedovato, Hans-Joerg Mettig & Grischa Hahn)

サマリ

このレポートは2012年8月〜12月の木星をカバーしていて、以前のレポートno.3やno.6【文献1,2】に続くものである。この期間、木星の外観はNEBとNTB復活のドラマの後でかなり通常に戻っているが、これらの領域にはまだ多くの複雑な活動があり、赤味がかった色が今もNTB(S)やNEBとEZの一部に広く拡がっている。NNTBは今も存在していないが、我々はNNTZに長寿命な暗斑を追跡していて、その最近の歴史を付録1にまとめている。次第に赤くなった大赤斑と非常に赤いBAとの会合もまた目立った外観を見せている。

このレポートとともに、6個の付録はさらに詳細を提供している。

付録1: NNTZ: 高気圧性暗斑、2008-2012年 (Gianluigi Adamoli & John Rogers)
付録2: NEBn: 白斑の動的相互作用
付録3: Equatorial Band(赤道バンド): 後端の追跡
付録4: SEBn: 新しい南赤道攪乱(South Equatorial Disturbance)?
付録5: 帯状風プロファイル (Grischa Hahn)
付録6: 木星面上の流星 (Dr Ricardo Hueso)


方法

しばしば困難な気象条件にも関わらずに、観測期を通して多くの素晴らしい画像を産み出してくれる、全ての観測者に感謝する。時々はいくつかの高解像度が同時に得られるけれども、残念ながら空間が全ての観測者から適切な画像を見せることを妨げるが、全ての画像が評価されている。また、観測期に様々な興味深い現象についてコメントしている、特にChris Go, Christophe Pellier, Manos Kardasis, Gianluigi Adamoli, Michel Jacquessonに感謝する。

NEBの進行中の混乱やEZの微妙なシフトするストリークと陰影のような、今シーズンの活動の多くは、画像が高解像度のマップ・アニメーションになるならば、より良く評価されるだろう。しかしながら、これには多くの注意深い作業が要求されるだろうが、異なる画像で変化する解像度やカラー・バランスによって、さらにある領域は通常は3個の連続回転体上で(次の2個ではない)撮影されることを意味している、観測者の経度分布によって、困難になっている。

Grischa Hahnは、付録5に示すように、9月、11月、12月の画像から帯状風プロファイルを作成した。現在は見えない斑点も捉えていて、全てのジェット気流が良く見られる。一般的に、これらは探査機からの以前のプロファイルと非常に似ていて、NEBやNTB復活が帯状風プロファイルを変更しなかったことを確認している。

通常のように、全ての画像やマップは南が上で示す。特記のない限り、斑点の速度はJUPOSチャートから測定され、DL2(30日での体系II経度)として引用される。全てのJUPOSチャートは赤色で白斑を、黒色で暗斑を示す。

全体の外観

数ヵ月に渡る進歩するカラー変化がある(図1)。大赤斑、NEB、BAの全ては暗化して赤くなった。NEBのほとんどは、少なくとも新しいリフトによって影響されない領域に、沈静化した復活の乱流のように暗化して赤くなっているように見える。しかし、その北エッジは灰色で明るくなっている。反対に、復活の後で8月に暗く強いオレンジ色だったNTB(S)は次第に淡化している。

木星の主なゾーンもまたかなり異なるカラーをしている。NTropZは今も非常に狭いが、その初期の黄土色の陰影は白く明るくなっている。EZはいくつかの経度に幅広い黄土色のEBがあるが、これも夏以降青白くなっている。NTZ-NNTZは一つの幅広い白色のゾーンを構成し、NNTBは存在しない。また、STBが薄い多くの経度で、STropZ-STZも幅広い白色のゾーンを構成しているが、他のゾーンよりは青く、確かに11-12月の画像でははっきりと青い。木星のカラーの絶対的基準が無いので、STropZ-STZは実際に白く、NTZ-NNTZを含む他の全てのゾーンはある程度赤味がかっている可能性がある。

メタンバンドや紫外線フィルターの画像を図4,10,12に、他のメタンバンドの画像を付録に示す。

メタンバンドの完全マップとレポートがManos Kardasisによって公開されている。
http://kardasis.weebly.com/jupiter-2012-13.html

北北温帯領域(N.N.Temperate Region)

NNTBとNNTBsジェット気流暗斑はNTB outbreakの間に一掃されて、今も存在していない。北北温帯領域全体は一つの幅広い白色のゾーンにNTZとマージしているように見える。かすかな小さいストリークだけといくつかのかすかな小さいジェット気流暗斑がNNTBの緯度に検出されたが、これらは一時的であった。

しかしながら、一つの暗斑は異なる。それはNN-LRS-1で、少なくとも1993年以来存在している、しばしば赤味がかった高気圧性暗斑である【文献3】。今観測期は強い赤色で、特にリムが暗い。SEBが明化すると、大赤斑が暗化して赤くなる傾向があるように、暗斑はNNTBが2009年に一時的に白化していた間と同様に見える。

第2の小赤斑(Little Red Spot)も、主にメタン画像で明るいことから、NNTZに検出された。これが長期間持続するかどうか分からないので、'LRS-b'という一時的な名称を与える。可視光では非常に小さく、しばしばほとんど見えないが、良好な画像では明るく淡いピンク色に見える。何人かの観測者の高解像度画像でほとんど見られないので、カラーは使用するフィルターやチャンネルに敏感であるようだ。G. AdamoliとC. Pellierはこれを小さな白斑として2012年夏か、あるいはおそらくもっと前までたどっている。歴史やJUPOSチャート、これやNNTZの他の高気圧性斑点の画像集については付録1を参照。(LRS-1とLRS-bとは別に、この緯度に2個の他の弱いメタン・ブライトな白斑があって、これらは以前の観測期から追跡されている小さな白斑である。)

北温帯領域(N.Temperate Region)

復活したNTBは今なお幅広く濃い二重のベルトである。南組織は特徴が無く、赤味が強く、次第に淡化している。北組織は、以前のNTB outbreakの後の2008年のように、濃い灰色で特に波状である。2つの組織は、最も高解像度では、無数の小さな白斑から構成される狭いストリップによって分けられている。NTBnエッジの開口部の乱れたリフトを構成する一つのセクターで顕著で[図4]、時々ミニoutbreakを引き起こしている(たとえば9月15日にChris Goが指摘したように)。

JUPOSデータによると、NTBnの模様のドリフトは非常に多様であるが、全ては北温帯流(N. Temperate Current)の正常範囲内にある(図5)。リフトはDL2=約+16度/月を持ち、その前端に様々の模様があり、NTZの異常に明るい白斑を含む(メタン画像でも明るい)。さらに前方の多くの模様はDL2=+約22±3度/月であるが、うねりが最も目立っているリフトの後方の多くの模様はDL2=+30度/月である。しかしながら、異なる速度のトラックは2008-2009年のように点在しているが【文献4,5】、これらのパターンのダイナミクスを決定するためにさらなる研究が必要だろう。(Grischa Hahnの帯状風プロファイルはNTBの緯度を横切る明確な勾配を示す。付録5を参照。)

リフト後方の一つの斑点はDL2=+69度/月のNTBnジェット気流で移動したから、リフトはこの後退ジェット気流を攪乱しているように見える。我々が2008-2009年に観測したもの【文献4,5】が、1年かそこらで起こっても不思議ではないが、これらの現象はNTZに拡がる北温帯攪乱(N.Temperate Disturbance)に発達した。

NTB(S)はオレンジ色で、特徴が無く、次第に淡化している。その南エッジはメタン・ブライトだけである(図10)。

北熱帯領域(N. Tropical Region)

NTB復活とNEB復活の乱れが沈静化したので、NEBとNTropZは次第に通常の外観を取り戻している(図1,3)。NEBの多くは、少なくとも新しいリフトに影響されない領域で、暗化し赤くなっているように見える。しかし、拡がったベルトが再び南に後退し始めると、その北エッジは灰色で明るくなっている。また、以前は淡い黄土色の陰影に覆われていたNTropZは、明るくなって、今は白色である。しかしながら、NEBのリフト活動は8月下旬に始まって以来見事に発達したから、現在の状態は静止とは呼べないし、またNEBnの発達したバージや白斑は今もいくつかのマージや観測された他の相互作用によって不安定である。

これらのバージや白斑を図6に示す。これは初期のレポート【文献1】のチャートを拡張して、3個の高気圧性白斑(AWO、赤点)の起源を示すが、長寿命の白斑Z(10-11月にDL2=-42度/月、おそらく以前よりは速い、11-12月にDL2=-38度/月)と同様に、白斑A(今はDL2=-22度/月)を形成するために連続したマージを経験している。チャートから、最大10個の小さな茶色のバージも発達したが、いくつかはマージしたか、リフトによって破壊されて、今は4個のみが残っている。

付録2(図N1-N5)は、NEBnのこれらの斑点の相互作用を示すために、5個の経度セクターの画像の詳細な並びを表わす。AWOのペアとバージのペアの良く観測されたマージは、過去何年にこの緯度に観測された同様なマージと同じ特徴を示している。バージのマージはかなり共通している。我々はIarus(2006)の論文に3個の例を報告し【文献6】、それ以降少なくとも6個の例を観測している【付録2の文献を参照】。AWOのマージは2006年まではっきりと観測できなかったが、それ以降6個のマージを、いくつかは詳細を記録している【付録2】。他の緯度のAWOのマージ【文献6】と異なり、NEBnのマージは不完全に思われ、通常は直後に消失するけれども、白雲か一方の白斑のフラグメントが遅いドリフトの他方の南後方に出現する。

一方、NEB北エッジはすでに明るくなり分裂している。長いセクターが淡い灰色になり、その上に侵入する明るいパッチがある。だから、復活に引き続く拡幅はすでに後退しているように思われるが、そのことは狭小化や復活の別なサイクルが3年周期以内に引き続いて起こることを示唆している。

NEBリフト(NEB rifts)
我々の以前のレポートno.6【文献2】に示すように、いくつかの目立った白斑が出現し、その後リフトとして拡がるという、新しいリフト活動が8月下旬にNEBに出現した。JUPOSチャート【図7】やマップ【図3】から、この活動がどのように急増し、NEBに拡がって、半周を占めているかが分かる。5個あるいは6個のリフト領域が出現していて、小さな明るい白斑として始まり、通常は拡がる。リフト領域はDL2=約-2.0〜-1.75度/日であるが、その中のリフトはDL2=約-3.7〜-2.7度/日である。

赤道領域(Equatorial Region)

NEBsダーク・プロジェクション(NEBs dark projections)
8月以降、NEBsには典型的な大きな青灰色のダーク・プロジェクションあるいはプラトー(plateau)のかなり安定な並びがある(JUPOSチャート【図8】とマップ【図9】を参照)。8月には13個あったが、11-12月には10か11個に減少した。少しの接近したプロジェクションがDL1=-4〜-5度/月であるのに対して、ほとんどはDL1=+6〜+16度/月である。

赤道ゾーン(Equatorial Zone)
EZは広く白っぽいが、フェストーンや薄い青灰色のストリーク、不規則な黄土色の赤道バンド(Equatorial Band (EB))を含む拡散したバンドの複雑な混合物で満たされている。8月にこのEBはL1=約250度から355度まで拡がったが、特に前端部で、その程度やカラーは秋に次第に減少した。それで12月までに、多くの経度で黄土色のトラックは残っていたけれども、短いセグメントだけが本当に注目された。

黄土色かオレンジ色のEBは今の観測期で最も興味深い模様の一つで、それでさらに研究するために、8月21日〜11月10日のその部分が最も良く見える後端部のたくさんの画像を集めた。選択された高解像度画像が図10で、完全セット(さらにメタン画像を追加)が付録3である。特殊な動きや傾向はオレンジ色と関係していないようなので、結果はあまり有益ではなかった。これは異常に目立っていたけれども、後端はNEBsプロジェクションの南(このような雲の典型的な位置)に安定して位置していた不規則な白っぽい雲であるように思われた。隣接したNEBsプロジェクションはNEBを通過するリフトと強く相互作用した(9月11日から10月下旬まで、付録3の画像を参照)けれども、これは全体の動きではなくて急激な短期的変化を示した。
EBの第2の後端は10月にさらに約40度後方に見られた。これもまた、おそらく関係しているNEBsプロジェクションとフェストーンの南に位置している、非常に明るくダイナミックな白雲によって形成されたが、11月上旬には消失した。他のこのような模様は時々他の経度で見られた。
メタンバンド画像では、オレンジ色のEBの後端はかろうじて見えた。EZの主なメタンダークの模様は青灰色のストリークとフェストーンで、それに対してNEBsの主な濃い青灰色のプロジェクションはNEBsに沿ったメタンブライトのバンドによって部分的に隠されていた。11月まで、目に見える色の付いたストリークとは関係ない、連続したメタンダークのEBがあった。

SEBn: 新しいSEDか?
多数の山形状模様がいつもように高解像度画像でSEBnに見られる。新しい南赤道攪乱(S. Equatorial Disturbance,SED)が形成されている強い証拠がある(付録4)。
新しいSEDの主な証拠はJUPOSチャートによる。2012年8月以降、SEDの同様なダイナミックなサイン、すなわち、低い白斑濃度のバンド、SED自体を表す+のDL1での移動、速度がSEDから東方に増加している山形状模様の速度勾配を見せている。しかしながら、示唆する模様が該当する経度に繰り返し出現するけれども、画像は一貫してSEDの特徴的な形態を示していない。私は、『生まれるのに苦労する』初期のSEDがあって、今後数ヵ月で古典的なSEDに発達するだろうことを提案する。

南熱帯領域(S. Tropical region)

SEBは大赤斑後方でいつもの激しいリフト活動(明るい対流攪乱)を見せている。

SEB中央に2個の目立った斑点、非常に暗いバージと不規則な白斑がある(図2,3)。これらはそれぞれ、8月1日にL2=83,107度、12月10日にL2=124,137度であった。白斑は不思議で、とても大きく、クリーム色で、安定している(2011年7月以来存在している)が、通常の循環気流の形態をしていない。しかしながら、内部の楕円の外形が9月20日のHSTと12月28日のThai National Obs.(S. Poshyachinda, TNO & NARIT)の超高解像度画像に見られる(これらの両方の画像を転送してくれたChris Goに感謝する)。このことは白斑が確かに低気圧性循環気流であり、暗いバージと同様であるが、北側にも不規則に拡がった白雲で満たされていることを示す。バージと白斑は段階的に収れんしている。これらは12月を通してちょうど13度(中心間)離れている。何かの接近の相互作用は見るのに興味深い。

本来のSEBsエッジ(南緯19-20度)は大きく攪乱されていなくて、2個の斑点だけが後退ジェット気流に追跡されている。一つは9月にDL2=+159度/月(おそらくこれまでに記録された最速の後退速度)で、もう一つは12月にDL2=+120度/月であった。しかしながら、帯状風プロファイル(以下を参照)は、異なる斑点にマークされない、ジェット気流が今も存在していることを示す。

すぐ南の南緯22度には、全ての経度で灰色のストリークが特別なバンド('SEB(SS)'?)を形成している。JUPOSチャートから、これらの灰色のストリークは広い速度範囲を持ち、DL2=0〜+54度/月であるが、ほとんどは+10〜+18度/月に固まっている。
(これらのストリークは、2011年には大きかった南熱帯バンド(S.Trop.Band)のさらに北にあり、また南熱帯バンドは2012年7月には薄いけれども今も存在している。その後端は7月中旬のL2=140度から8月上旬のL2=90度まで前進し、その後8月中に完全に消失した。)

大赤斑(図1,12)は12月1日にL2=187度にあり、2011年半ば以来DL2=+1.2度/月を維持していて、90日振動がJUPOSチャートにいつものようにはっきりと見られる。最初は非常に淡かったが、観測期の間に次第に暗化して赤くなっているように見える。8-9月に南エッジ付近にかすかなダーク・ストリークがあったが、孤立したオレンジ色の楕円斑点として大赤斑を残して、12月までに消失した。

南温帯領域(S. Temperate region)

いつものように、STBはほとんどの経度で非常にかすかなSTB(N)以上ではなく、かなりの模様を持ついくつかのセクターがある(図2,11,12)。これらは以下のようである。

1) 白斑BA(図12)。これは観測期の最初にかなり強いオレンジ色を取り戻して、それ以降さらに濃度を増している。今は大赤斑よりも木星で最も強く赤い。Christophe PellierとDamian Peachは、オレンジ色は口径10inchでも眼視でたやすく見ることができると報告している(2013年1月)。いつものように、カラーは淡いコアを持つ環の内部である。BAは9月1日に大赤斑を通過した。それ以前はDL2=-12度/月で、以降はDL2=-10度/月であった。

2) BA後方には、かなり安定した低気圧性斑点の異常なペアがある。BA後端の最初の斑点は小さく、白い縁のあるとても濃い暗斑である。(観測者はここ数週間でその暗さが弱くなっていると指摘した)。第2の斑点は、9-10月に暗斑の13度後方にあり、大赤斑を通過した後の11-12月にたった10度後方になった、変化する淡い青灰色のストリークに囲まれた白斑である。両方の斑点は、BAよりは低い緯度にあるので、低気圧性で、メタンダークでなければならない(図12)。驚くことに、これらの間のSTZの白いスペースは、通常はこの位置には小さな高気圧性白斑(AWO)があるけれども、高気圧性白斑ではない(確かにメタンブライトではない)。

3) STBの唯一の幅広い暗いセグメントは長さ60度で、DL2=-18度/月で、BA後方の白斑の集団に急速に収れんしている。多くのこのようなSTBセグメント(たとえばCassini動画)のように、STB(N)の前方(最も良く決定されたものはDL2=-48度/月、これらは約10-20度を超えて続かない)と、STB(S)の後方(DL2=約0〜+21度/月、数10度後方で、最後は南のダークストリークになる)に小暗斑を放出する乱れた低気圧性セクターのように見える。その前端は今は低気圧性白斑に非常に接近していて、そのために相互作用はいつ始まるかもしれない。このような相互作用が起こった最後は2010年で、活動の目立ったoutbreakを見せた【文献7】。
STBのベルトセグメントがBAを含む複合体に流れる時に、これらの相互作用は数年毎に起こる。そして、新しいSTBの模様が開かれたギャップを埋めるためにいつも形成される。通常はこれは低気圧性複合体である。今観測期には、STBのダークセグメントの約145度後方にこのような模様がある。

4) 2011年8月に出現した小暗斑は、2012年7月と8月にとても暗く、DL2=-16度/月であった。小暗斑は8月から10月まで次第に淡化し、そして11月下旬までに淡い灰色の斜めのストリークに埋まった、小さな明るいピンク色の斑点に変わっている。今は非常に淡いけれども、小暗斑はSTBのこのセクターを支配する新しい低気圧性攪乱になるかもしれない。

南南温帯領域(S.S. Temperate region)

南緯40-41度に9個の安定なAWOがあり、図2,3と図13[JUPOSチャート]にラベルを付けた。この集団は、出現したり消失したりけれども、何年も連続して追跡されているから、これらはA0からA9(A2は無い)のラベルを付ける。SSTBはA1とA3の間の低気圧性の白いストリップによって置き換っている。

さらに南の、南緯約50度と南緯約60度の長寿命なAWOは今も良く追跡されている。これらは変化する速度を持つ。南緯60度の白斑は9月上旬から12月下旬までL2=95度に事実上静止していたが、一方南緯50度の白斑は、前後には急速に前進していたけれども、10月27日から11月8日までその真北で停止していた。


参考文献

[]内はBAA木星セクションのwebサイトの中間レポートを含めた以前のレポートへの番号を示す。

1. [2012 No.3]. Progress of Jupiter's great northern upheaval, 2012 July-August.
http://www.britastro.org/jupiter/2012_13report03.htm

2. [2012 No.6]. Renewal of rift activity in the revived NEB: Image set of GRS hemisphere, 2012 Aug-Sep.
http://www.britastro.org/jupiter/2012_13report06.htm

3. Rogers JH, Adamoli G & Mettig H-J (2011) ‘Jupiter’s high-latitude storms: A Little Red Spot tracked through a jovian year.’ JBAA 121 (no.1), 19-29.

4. [2009 no.7] Jupiter in 2009: Interim Report, with new insights into the NTZ disturbance, NEB expansion, and SEB fading.
http://www.britastro.org/jupiter/2009report07.htm

5. [2009 no.8] Jupiter's North Temperate Region in 2009: The nature of the North Temperate Disturbance. (by G. Adamoli & J. Rogers)
http://www.britastro.org/jupiter/2009report08.htm

6. Rogers JH, Mettig H-J, Cidadao A, Sherrod PC, and Peach D (2006). ‘Merging circulations on Jupiter: observed differences between cyclonic and anticyclonic mergers.’ Icarus 185, 244-257. [http://www.britastro.org/jupiter/icarus.htm]

7. [2010 no.4] A triple collision of long lived circulations in the S. Temperate domain.
http://www.britastro.org/jupiter/2010report04.htm

8. [2012 no.5] Fireball on Jupiter, 2012 Sep.10.
http://www.britastro.org/jupiter/2012_13report05.htm

9. [2010 no.19] Some developments in Jupiter’s northern hemisphere
http://www.britastro.org/jupiter/2010report19.htm

10. Unpublished HST images on 2012 Sep.20, made by an international team headed by Dr Glenn Schneider (University of Arizona) and Dr Jay Pasachoff (Williams College and Caltech), as part of their attempt to detect the transit of Venus that was then visible from Jupiter. Their data reduction is under way. The SEB spot structure was pointed out by Christophe Pellier.


Click for the original size

図1 8月から12月までの大規模な変化。2つの3つ組画像、(上)Chris Go、(下)Damian Peach, Dave Tyler。合理的で一貫したカラー・バランスを持つように見えるこれらの画像には、数ヵ月の進歩する変化を見ることができる。大赤斑と白斑BAの両方は暗化し赤くなっている。そして、NEBの多くも、少なくとも新しいリフトの影響を受けない領域で、復活の乱れは沈静化したので、暗化し赤くなっている。しかし、NEBの北エッジは灰色で明るくなっている。また、以前は黄土色の陰影に覆われていたNTropZは明るくなり、今は白色である。反対に、復活の後の8月に暗くて強いオレンジ色であったNTB(S)は次第に淡化している。


Click for the original size

図2 2012年11月18-19日の画像からのマップ。ラベルを付けている。


Click for the original size

図3 2012年8月から12月までのベスト・マップ、Marco Vedovatoか観測者自身が作成、体系IIで並べる。


Click for the original size

図4 LRS-b, NTBリフト, 新しいNEBn白斑を含む画像セット。最上段と最下段は超高解像度画像とメタンバンド画像である。(図12も参照)


Click for the original size

図5 NTBnのJUPOSチャート。全てのJUPOSチャートでは、黒点が暗斑、赤点が白斑である。


Click for the original size

図6 NEBn/NTropZのJUPOSチャート。以前のレポート【文献1】のように、6月にNTropZの暗斑(青点、d4-d9)の少なくともいくつかは高気圧性白斑(AWO、赤点)になった。これらは、長寿命な白斑Z(10-11月にDL2=-42度/月、11-12月にDL2=-38度/月)のように、連続したマージを経て白斑A(DL2=-22度/月)を形成した。多くの非常に小さなバージも発達し、約0〜-15度/月の範囲のDL2であったが、今はおよそ4個だけを残して、いくつかのバージはマージを経たか、リフトによって壊された。


Click for the original size

図7 NEB中央のリフトのJUPOSチャート。


Click for the original size

図8 NEBエッジのJUPOSチャート、大きなダーク・プロジェクション(黒点と灰色の陰影領域、<>は暗い模様の前端と後端を表わす)を示す。2012年3月にNEB復活によって始まった非常に濃い後退暗斑とは対照的に、現在の並びはかなり安定して通常である。


Click for the original size

図9 2012年8月〜12月の赤道領域のベストマップ、Marco Vedovato作成、体系Iで並べる。これらのマップには、暗いNEBsプロジェクション、オレンジ色のEB、EZのストリークの微妙なパターンを追跡することができる。しかしながら、11月まで推定される新しいSEDはほとんど見られない。


Click for the original size

図10 オレンジ色のEBの後端(緑色矢印)。選択された高解像度画像とメタン画像。


Click for the original size

図11 南温帯領域のJUPOSチャート。白斑BAは緑色で示す。


Click for the original size

図12 2012年11-12月の大赤斑サイドのマルチスペクトル画像で、RGB、青、UV、メタンバンド(0.89um)画像を含む。(最下段右は反対サイドのセット)。いくつかのケースでは、未処理のメタン画像もある。画像処理は、メタンブライトな大赤斑や白斑BAの隣接にダークバンドのような偽の模様を産み出したり、ほとんど実際のコントラストのないように強調される傾向がある。南温帯、北熱帯、北北温帯領域のメタンブライトな高気圧性白斑を示す。南温帯領域のメタンダークな低気圧性斑点も同様に示す。大赤斑後方のSEBの対流プルームは11月8日だけメタンブライトである。NEBsとNTBsを覆うメタンブライトなストリップが今もある。NTropZは今もUV画像ではシェードされているが、青画像ではそうでない。EBはUVと青の両方とメタンで暗い。


Click for the original size

図13 南温帯領域のJUPOSチャート、9個のAWOを示す。(今観測期には追跡できる実際の低気圧性模様はなかった)。

John Rogers (British Astronomical Association), 2013 Jan.

【日本語訳:伊賀祐一 (Yuichi Iga)】