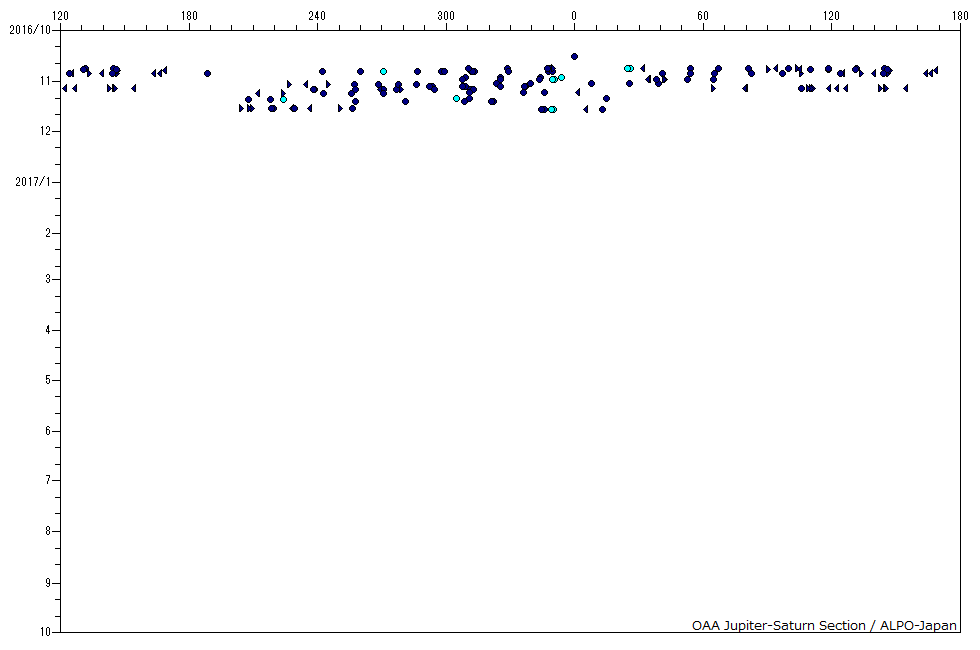
ドリフトチャート (2016-17 Apparition - NTBs jetstream)
Color
NTBs white marking
NTB dark marking
Shape
center
p. end
f. end
自転周期
模様
記号
期間
自転周期
ドリフト
測定数
観測期間
観測経度
緯度
衝の経度
風速(m/s)
outbreak leading spot
NTCW1
9h47m06.3s±14.4s
-5.077±0.356
6
2016/10/23−2016/10/30
25.7−349.5
+23.9±0.9
266.5±1.3
+163.0±4.7
NTB dark spot
NTCD1
9h50m24.2s±4.5s
-0.143±0.112
6
2016/10/25−2016/11/16
260.1−255.5
+24.7±1.7
235.8±1.2
+97.6±1.5
NTB dark spot
NTCD2
9h50m26.6s±7.3s
-0.084±0.181
13
2016/10/23−2016/11/12
313.0−307.5
+25.1±0.8
297.1±1.8
+96.5±2.3
NTB dark spot
NTCD3
9h50m15.4s±4.9s
-0.363±0.121
9
2016/10/23−2016/11/12
329.0−321.2
+25.0±0.9
268.5±1.2
+100.2±1.6
NTB dark spot
NTCD4
9h49m45.2s±6.7s
-1.111±0.165
11
2016/10/16−2016/11/07
359.8−335.8
+25.0±0.8
166.5±1.8
+109.9±2.1

 NTBs white marking
 NTB dark marking
 center
 p. end
 f. end