 |
Hello, Kuniaki Horikawa from ALPO-Japan.
Today, I would like to introduce an interesting phenomenon found from images posted to ALPO-Japan. |
 |
Look at this.
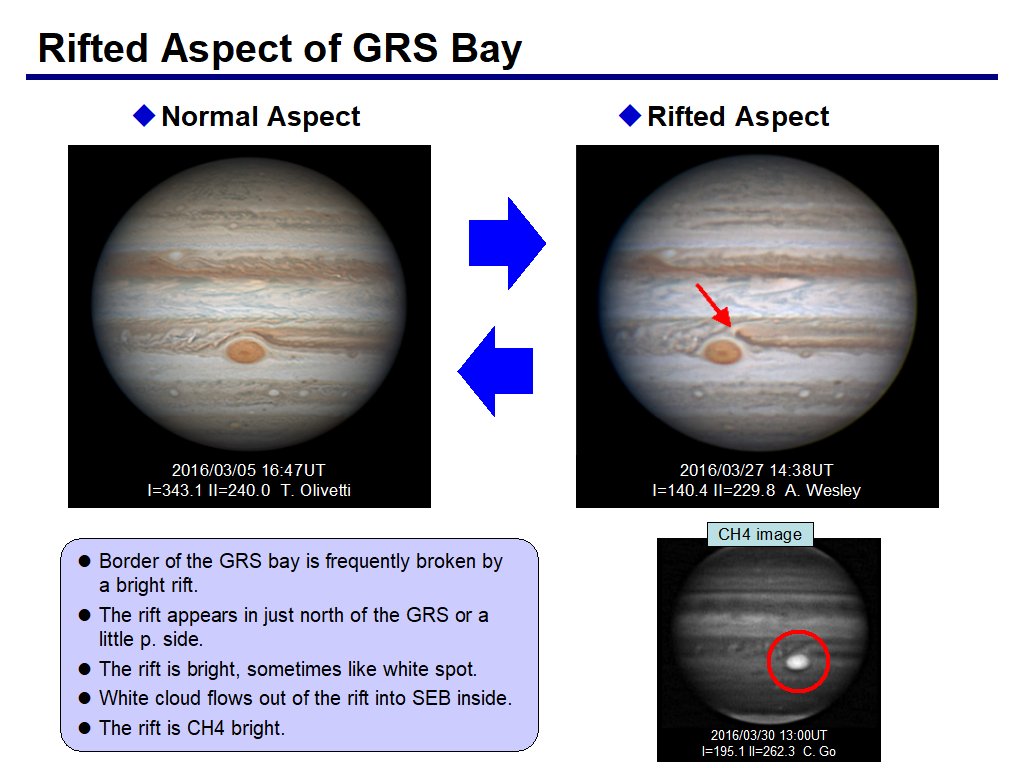
GRS, very familiar object for us.
Elliptical shape with orange color.
And it's embedded in SEB, forming a large bay.
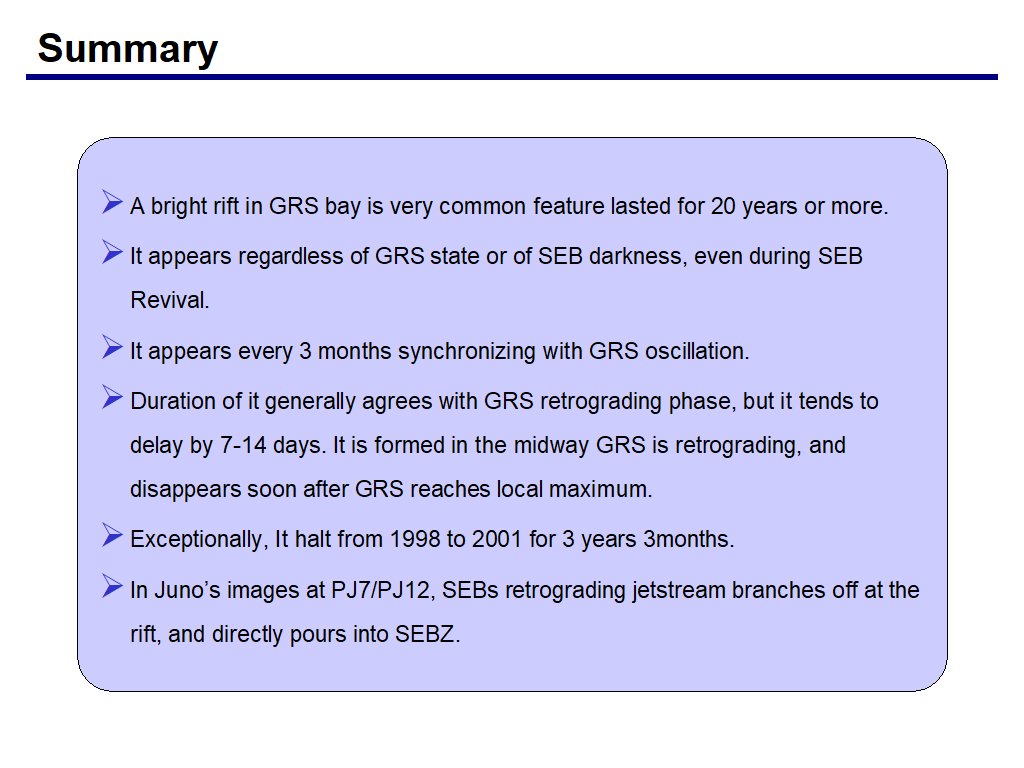
And this aspect is familiar too. A bright rift breaks the border of the bay, and white cloud flows into SEB inside. The rift is sometimes bright like a white spot, and it's a light feature in methane band image. This rift has frequently been observed in recent years. So, I tried to check through ALPO-Japan images how often it appears. |
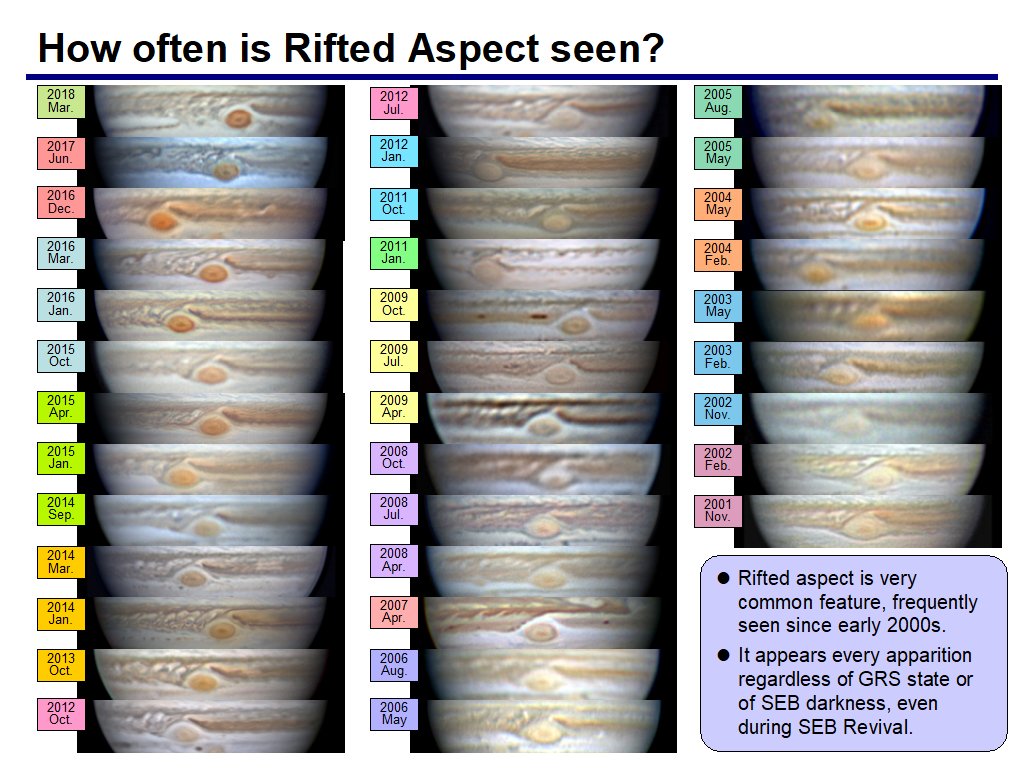 | I found plenty of instances of rifted aspect of GRS bay. These are only partial examples. Rift of GRS bay is very common since early 2000s. It appears in every apparition regardless condition of GRS or SEB, even during SEB Revival. |
 |
So, I looked into periodicity of the rift next.
I categorized the GRS bay aspect into 4 types, normal, rift, white spot, and unknown.
And this is a result after 2011. Though there are blanks because of between apparitions, rifted aspect generally appears twice in a half year. Therefore, I found it appears every 3 months. Wait, 3 months is 90 days, speaking of 90days, it's GRS oscillation. Is there any relationship between two phenomena? Next, I will check GRS oscillation. |
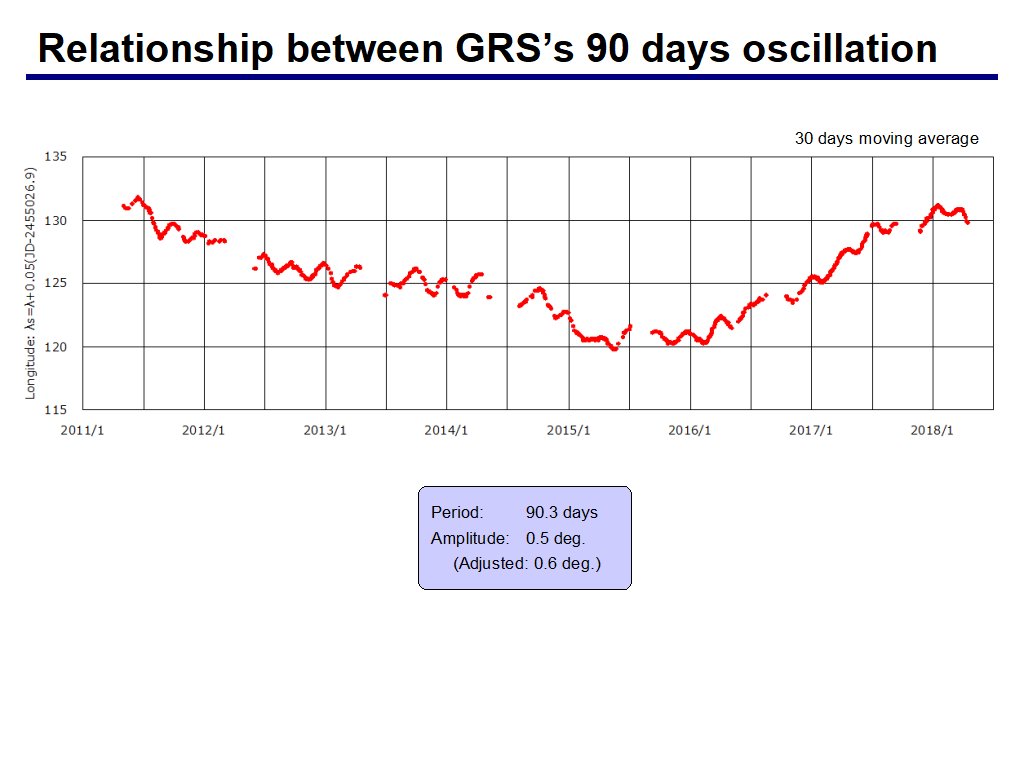 |
This chart is GRS longitude in special longitude system shown here.
Data are somewhat scattered due to uncertainty of rim of Jupiter disk.
So I take 30 days moving average.
GRS oscillation became evident. The GRS continues to oscillate with period of 90.3 days and amplitude of 0.5 deg. It's consistent with Solberg and recent JUPOS team. Amplitude is somewhat smaller than their result, since I used 30 days moving average. After adjusted this factor, I got 0.6 deg., and it agreed with their result. This apparition, GRS somewhat accelerated. It must be an effect of South Tropical Disturbance. To extract oscillation factor, I plot the deviations from regression line of each apparition, .. |
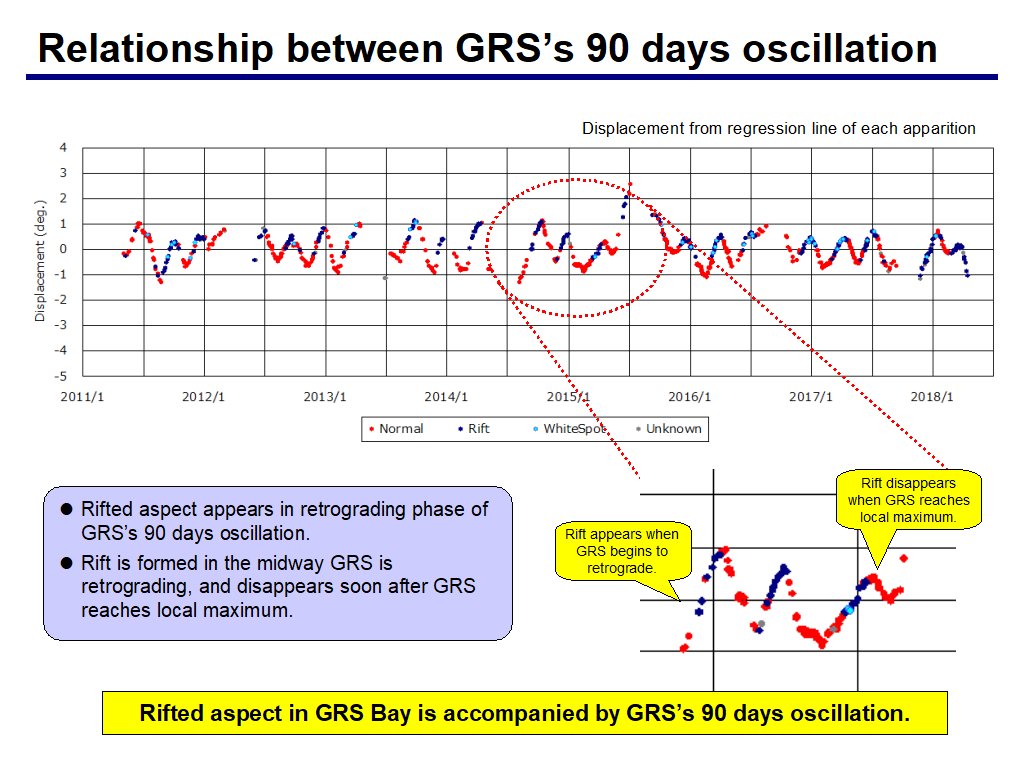 |
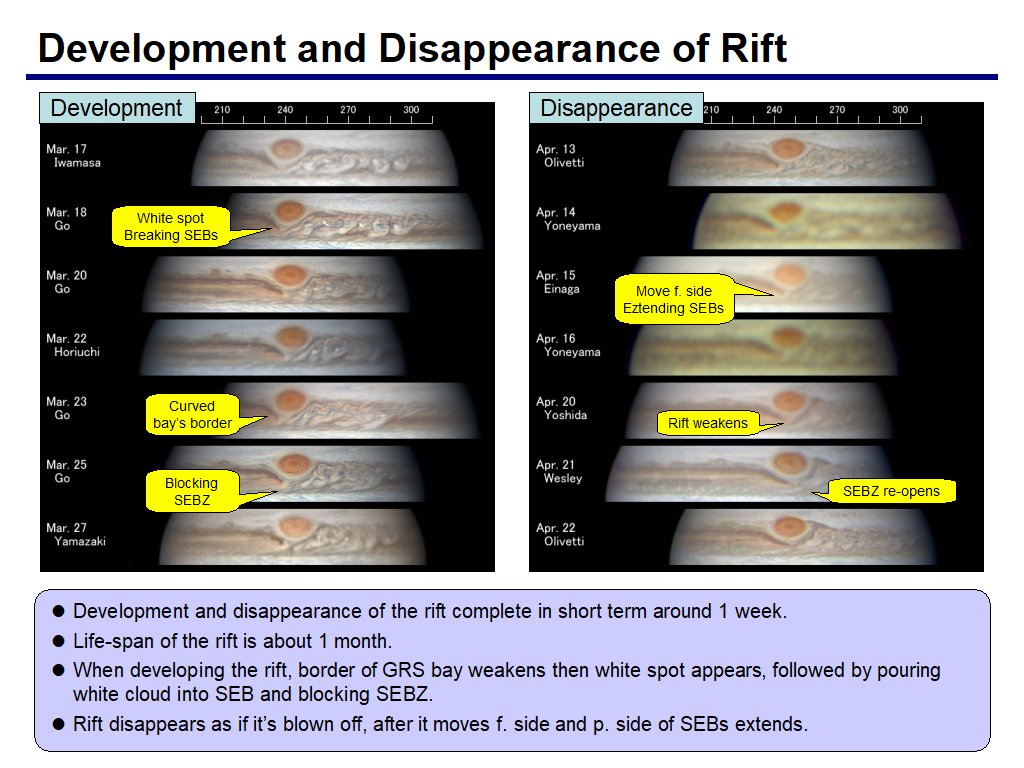
.. and make it overlap the rifted aspect frequency chart shown before.
And I combine two charts. As you see from this chart, rifted aspect tends to appear, when GRS is retrograding. I choose a typical case from the chart, and show it in detail here. Rift appears after GRS begin to retrograde, and disappears soon after GRS reaches local maximum. The rift of GRS bay may be a phenomenon related to GRS 90 days oscillation. So, I go back until the early 2000s to confirm my idea. |
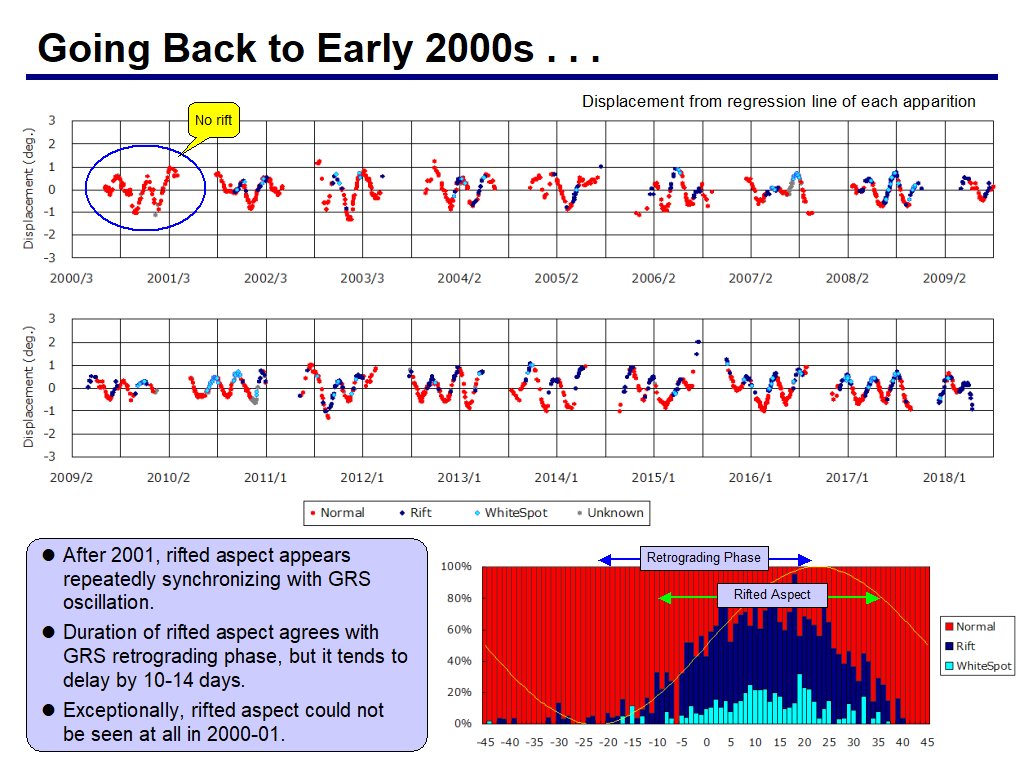 |
This chart is GRS oscillation since 2000 created in the same way as previous chart.
And I add the aspect of GRS bay to the chart, like this. Generally, rifted aspect appears in every apparition concurrent with retrograding phase of GRS as you saw in previous slide. But 2000-01 apparition is exceptional. No rift was seen at all. I will check this point in next slide. This chart is summary of relationship between rift and GRS oscillation. Horizontal line is oscillation phase from -45 day to +45 day, and vertical line is percentage of rifted aspect. The GRS moves like yellow line for your reference. Rifted aspect appears along with GRS retrograding phase, but it tends to be delayed for 10 or 14 days. At any rate, it's more than likely there is strong correlation between rift and GRS oscillation. |
 |
Next, I have to look at around 2000 when no rift was seen at all.
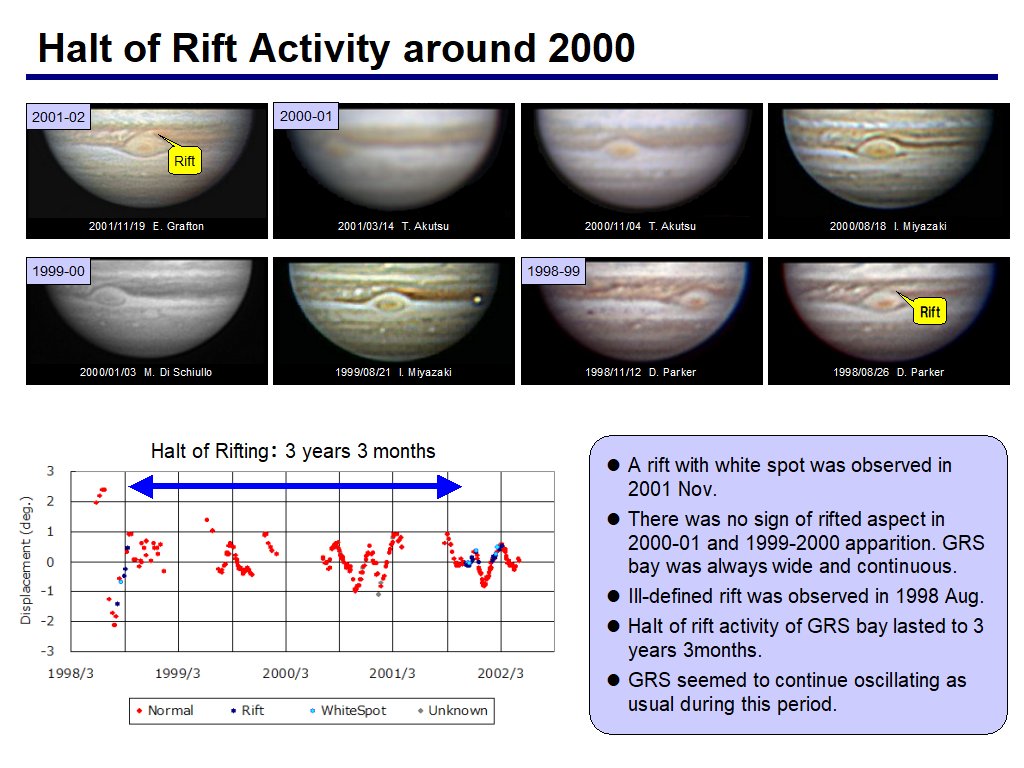
These are chosen from images of the month in which the rift was expected to be seen.
In 2001 November, a rift was observed. but in previous two apparitions no rift was seen. GRS bay was always continuous with thick border, it was wide and gently-curved bay. When I went back to 1998-99 apparition, I found an ill-defined rift in 1998 August. So, halt of rift activity of GRS bay lasted for 3 years 3 months. GRS was still oscillating in 2000. And although data are scattered because of fewer images, it must have been oscillating before 2000 too, because peak values agree with timings of local minimum/maximum of oscillation. If GRS oscillation had also stopped together, it would have been a great discovery. |
 |
Finally, let's look at Juno's images.
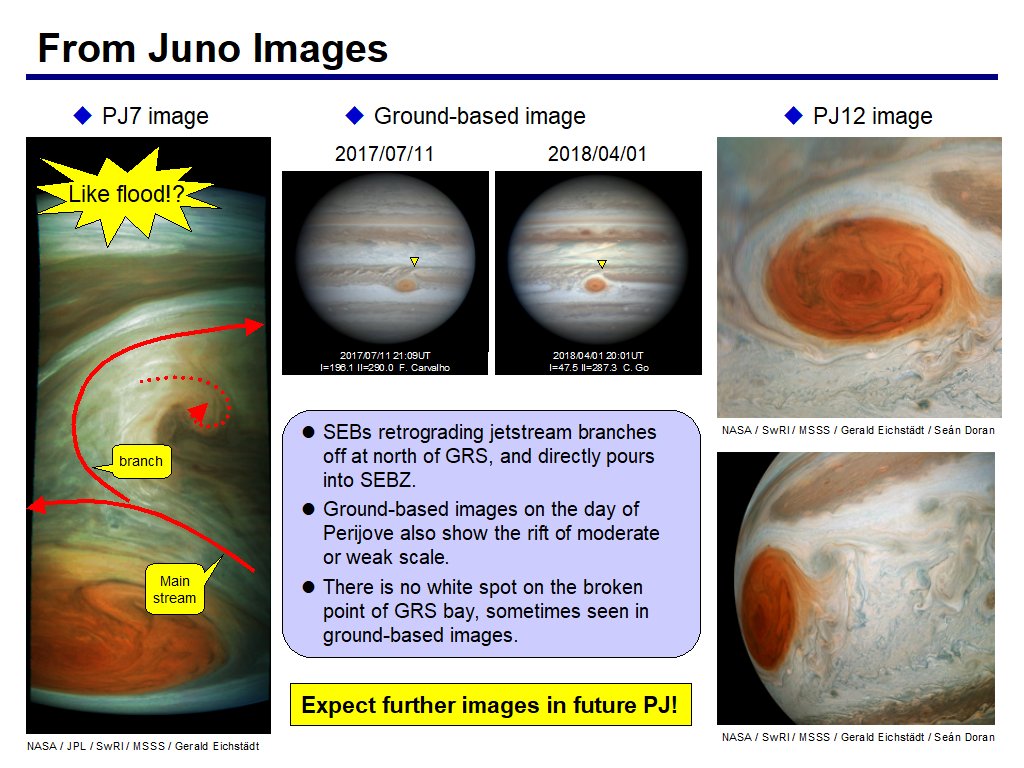
Juno observed the rift in PJ7 in last July and PJ12 in this April.
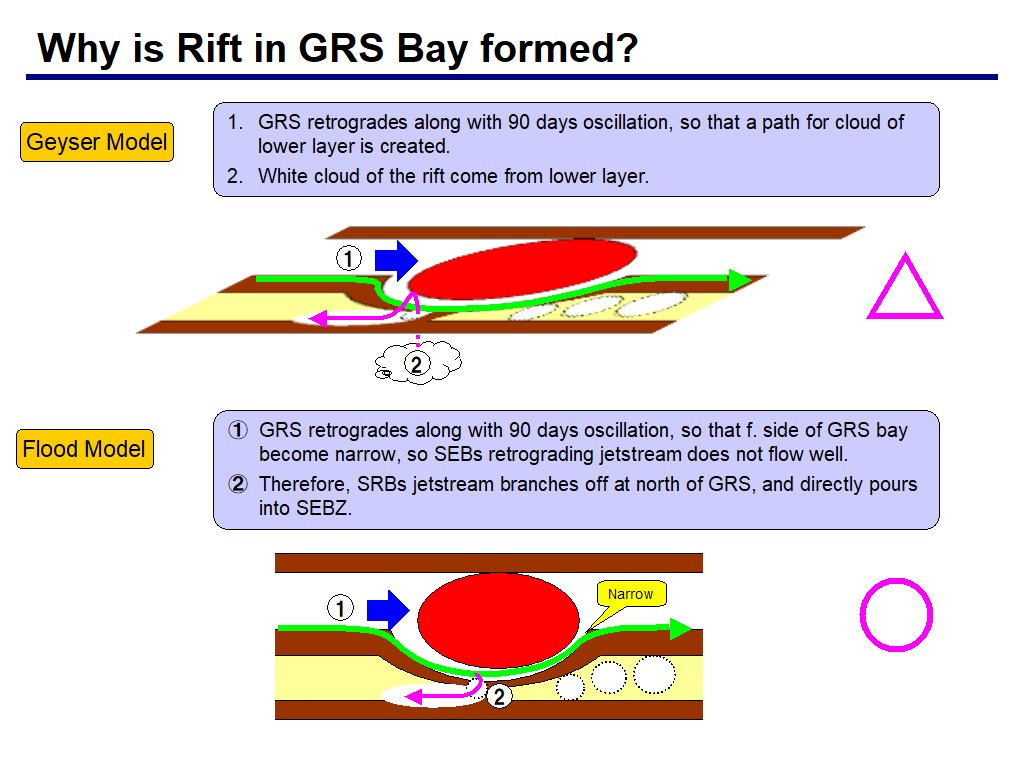
These images reveal SEBs retrograding jetstream branches off at north of GRS, and directly pours into SEBZ inside like flood. White spot sometimes seen in ground-based images cannot be seen here. Ground-based images on the day of Perijove show the rift, but it was moderate or weak scale. Is it really flood of white cloud? I expect further images in future PeriJoves. |
 | I have finished my talk. Although many questions remain, I think it is amazing to have found that GRS oscillation has a visible feature. |
 | Thank you very much for your kind attention. |
 | |
 | |
 |