Japanese
In 2012, Jupiter is displaying the unprecedented spectacle of two simultaneous great outbreaks in adjacent domains, comprising revivals of the NEB and NTB. Both started just before solar conjunction and largely developed during that period of invisibility, but spectacular disturbances were evident when the planet reappeared in June [Ref.1]. Now, with improved images as the planet rises higher, and with charts and maps from the JUPOS team, we have a clearer picture of what has been happening. This report covers July and early August. At the time of writing, in late August, the disturbed regions seem to be settling down. So, although further results may yet emerge, this may stand as our main report on these disturbances which are unprecedented in modern times.
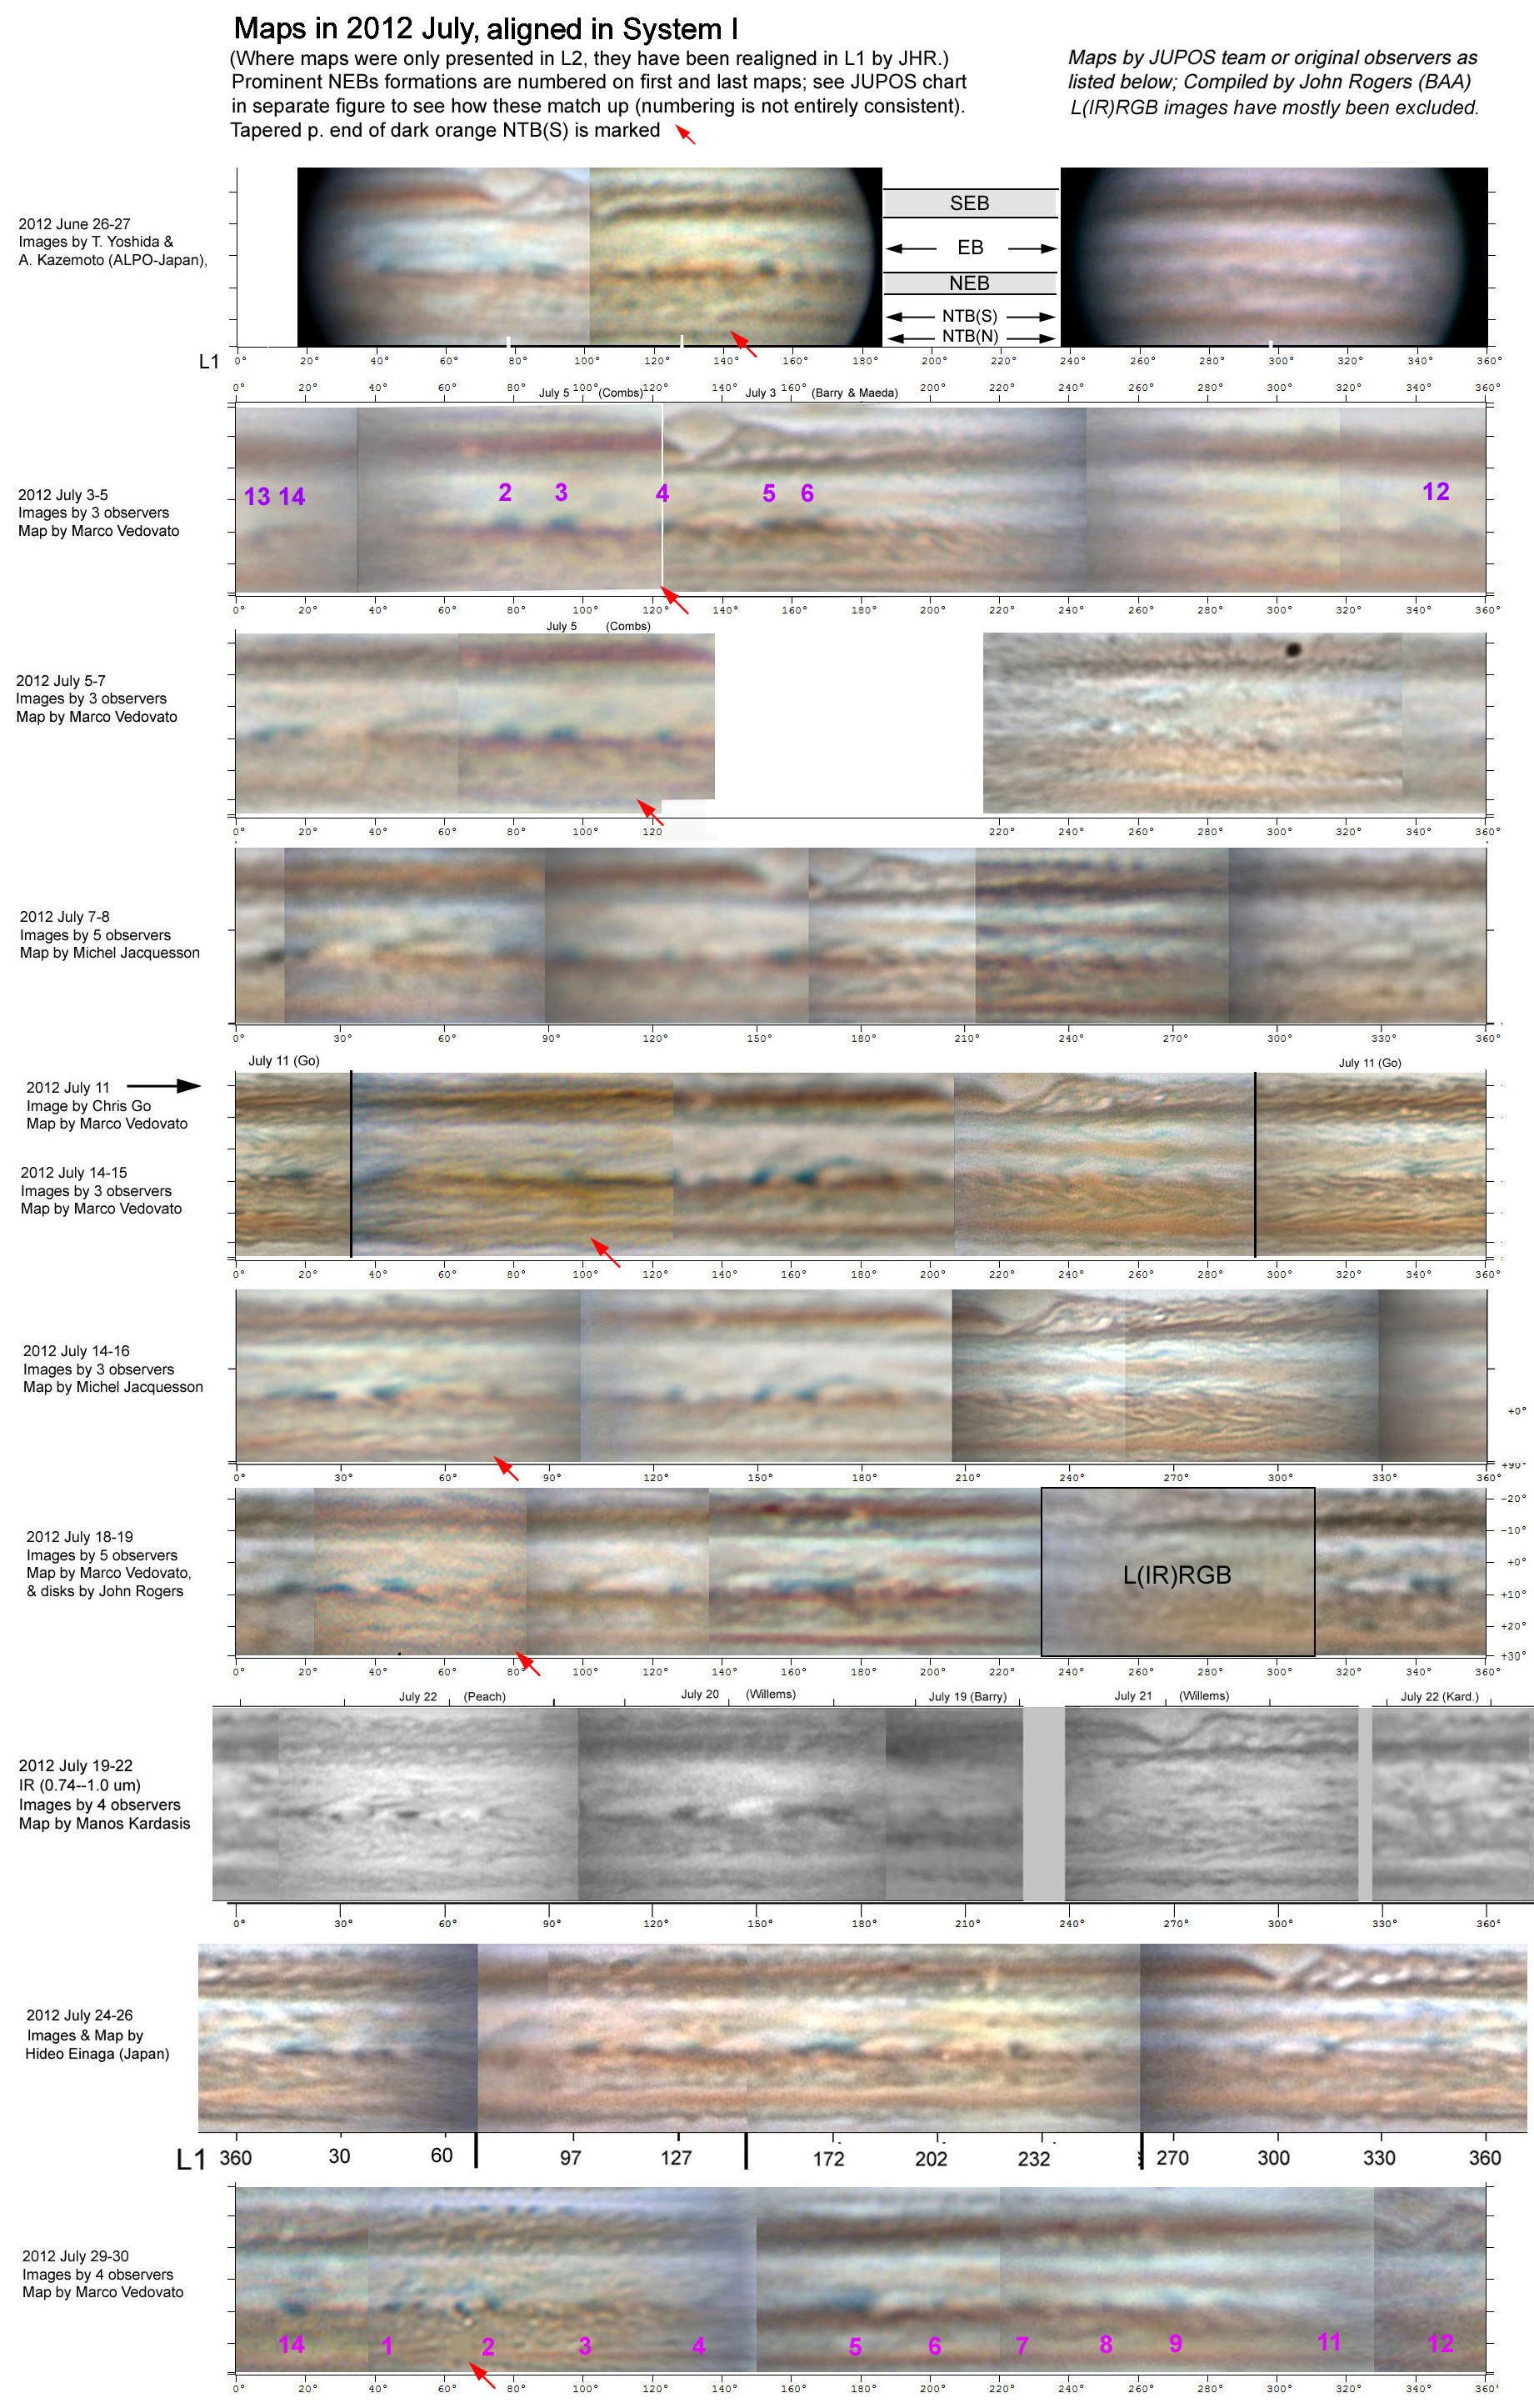
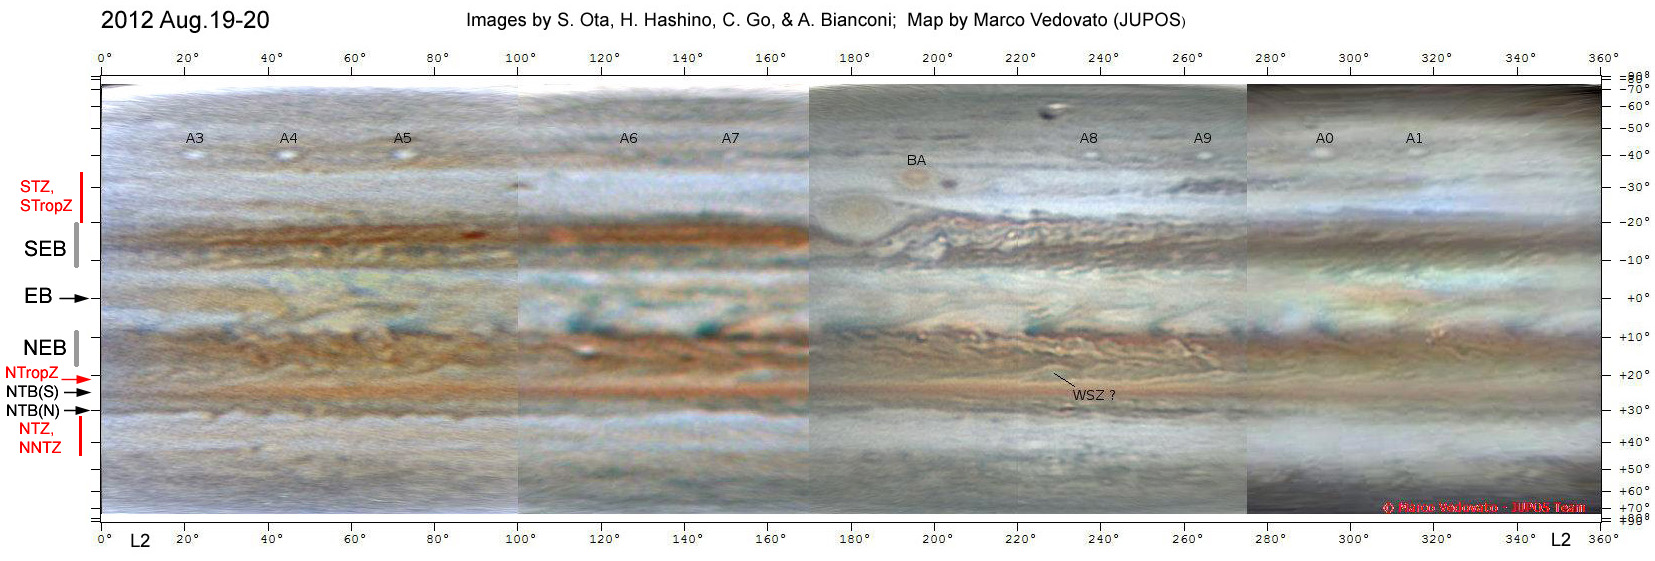
This report is arranged so that the main text is largely overviews and discussion, with specific details given in the Appendix (Notes 1-6) and Table 1. Maps of the northern hemisphere throughout July are aligned in Fig.1, and a more recent map of the whole planet is Fig.2. Images in the ultraviolet and infrared, along with latitude measurements in different wave-bands, are given in the accompanying Report no.4.
The NEB is indeed undergoing a full-scale revival for the first time since 1926, and the NTB is indeed reviving via a super-fast jet-stream outbreak as last seen in 2007. Sectors of the belts and the intervening NTropZ which were still light in June have now filled in with intense turbulence and reddish (ochre or orange) colour, producing one vast brown-and-ochre belt from the NEBs to the NTB. Large eruptions seem to be finished, and as usual in such events, the disturbance has evolved from larger to smaller scales, so by the end of July the whole region was filled with small streaks. These formed a remarkable herring-bone pattern across the whole region in hi-res images, displaying the wind gradients. Flanking domains are also affected: The NNTB has virtually disappeared, while there is an ochre Equatorial Band stretching half way around the equator.
Description
Equatorial Zone:
The pale ochre EB has been a notable feature of this apparition, and is no doubt associated with the NEB Revival in some way. It spans latitudes ~2 deg.N to S, and is mingled with some blue-grey streaks. It only exists around about half the circumference, and has been getting shorter [see Note 1 in Appendix], although fainter patches of similar colour exist at other longitudes.
More might be learned about this phenomenon from further study of the hi-res images. Can any source for the reddish colour be identified? Where it is absent, is that because it has not yet spread there or because it is being cleared away?
Northern EZ & Southern NEB:
The lighter sector of NEB had filled in, so at the start of July the whole NEB was light brown and filled with turbulent streaks, but with no distinct rifts. There was a dark NEB(S) around half the belt, carrying many very dark bluish-grey spots (typical ‘projections’), which extended round the whole belt by the end of the month.[Note 2]
These NEBs dark spots were quite well-formed and stable. Whereas the first NEBs dark spots in March-April had highly positive DL1, in July and August these spots had normal drifts: mean DL1 = +5 deg/month, range -7 to +15 deg/month (Fig.3). By early August there was a stable array of 13 of them around the planet. The main activity was between the spots numbered 14 and 1 and 2, which were repeatedly splitting to produce new, small, very dark, short-lived spots that retrograded with DL1 ~ +0.5 to +1.6 deg/day (Fig.4). This behaviour is typical alongside intense disturbances within the NEB, which tend to generate and partially entrain dark spots on or near the NEBs edge.
Within the NEB in July there was ubiquitous small-scale turbulence, but no distinct rifts nor bright spots [except, Note 2]. Bright spots would reappear in late August (e.g. one in Fig.2, perhaps representing the resumption of normal activity.
Northern NEB and N.Tropical Zone:
In June there were large-scale contrasts between different sectors, and several very dark grey spots at roughly fixed L2 in the NTropZ, but by early July, no obvious large features persisted (Fig.1). There were many dark patches scattered all across these latitudes (18-21 deg.N) but they were rapidly changing. Later in July, the main dark grey features were innumerable streaks lying obliquely across the northern NTropZ (20-22 deg.N), indicating the wind speed gradient. (Similar streakiness was also seen after the NTBs outbreak in 2007, so it may be due to either or both outbreaks.) Meanwhile the NTropZ also increasingly filled in with dusky ochre shading, mixed with the herring-bone pattern of grey streaks. In the less streaky sectors of NTropZ, hi-res images confirmed that there was definitely diffuse colour, which was not just due to low resolution (e.g. Fig.8).
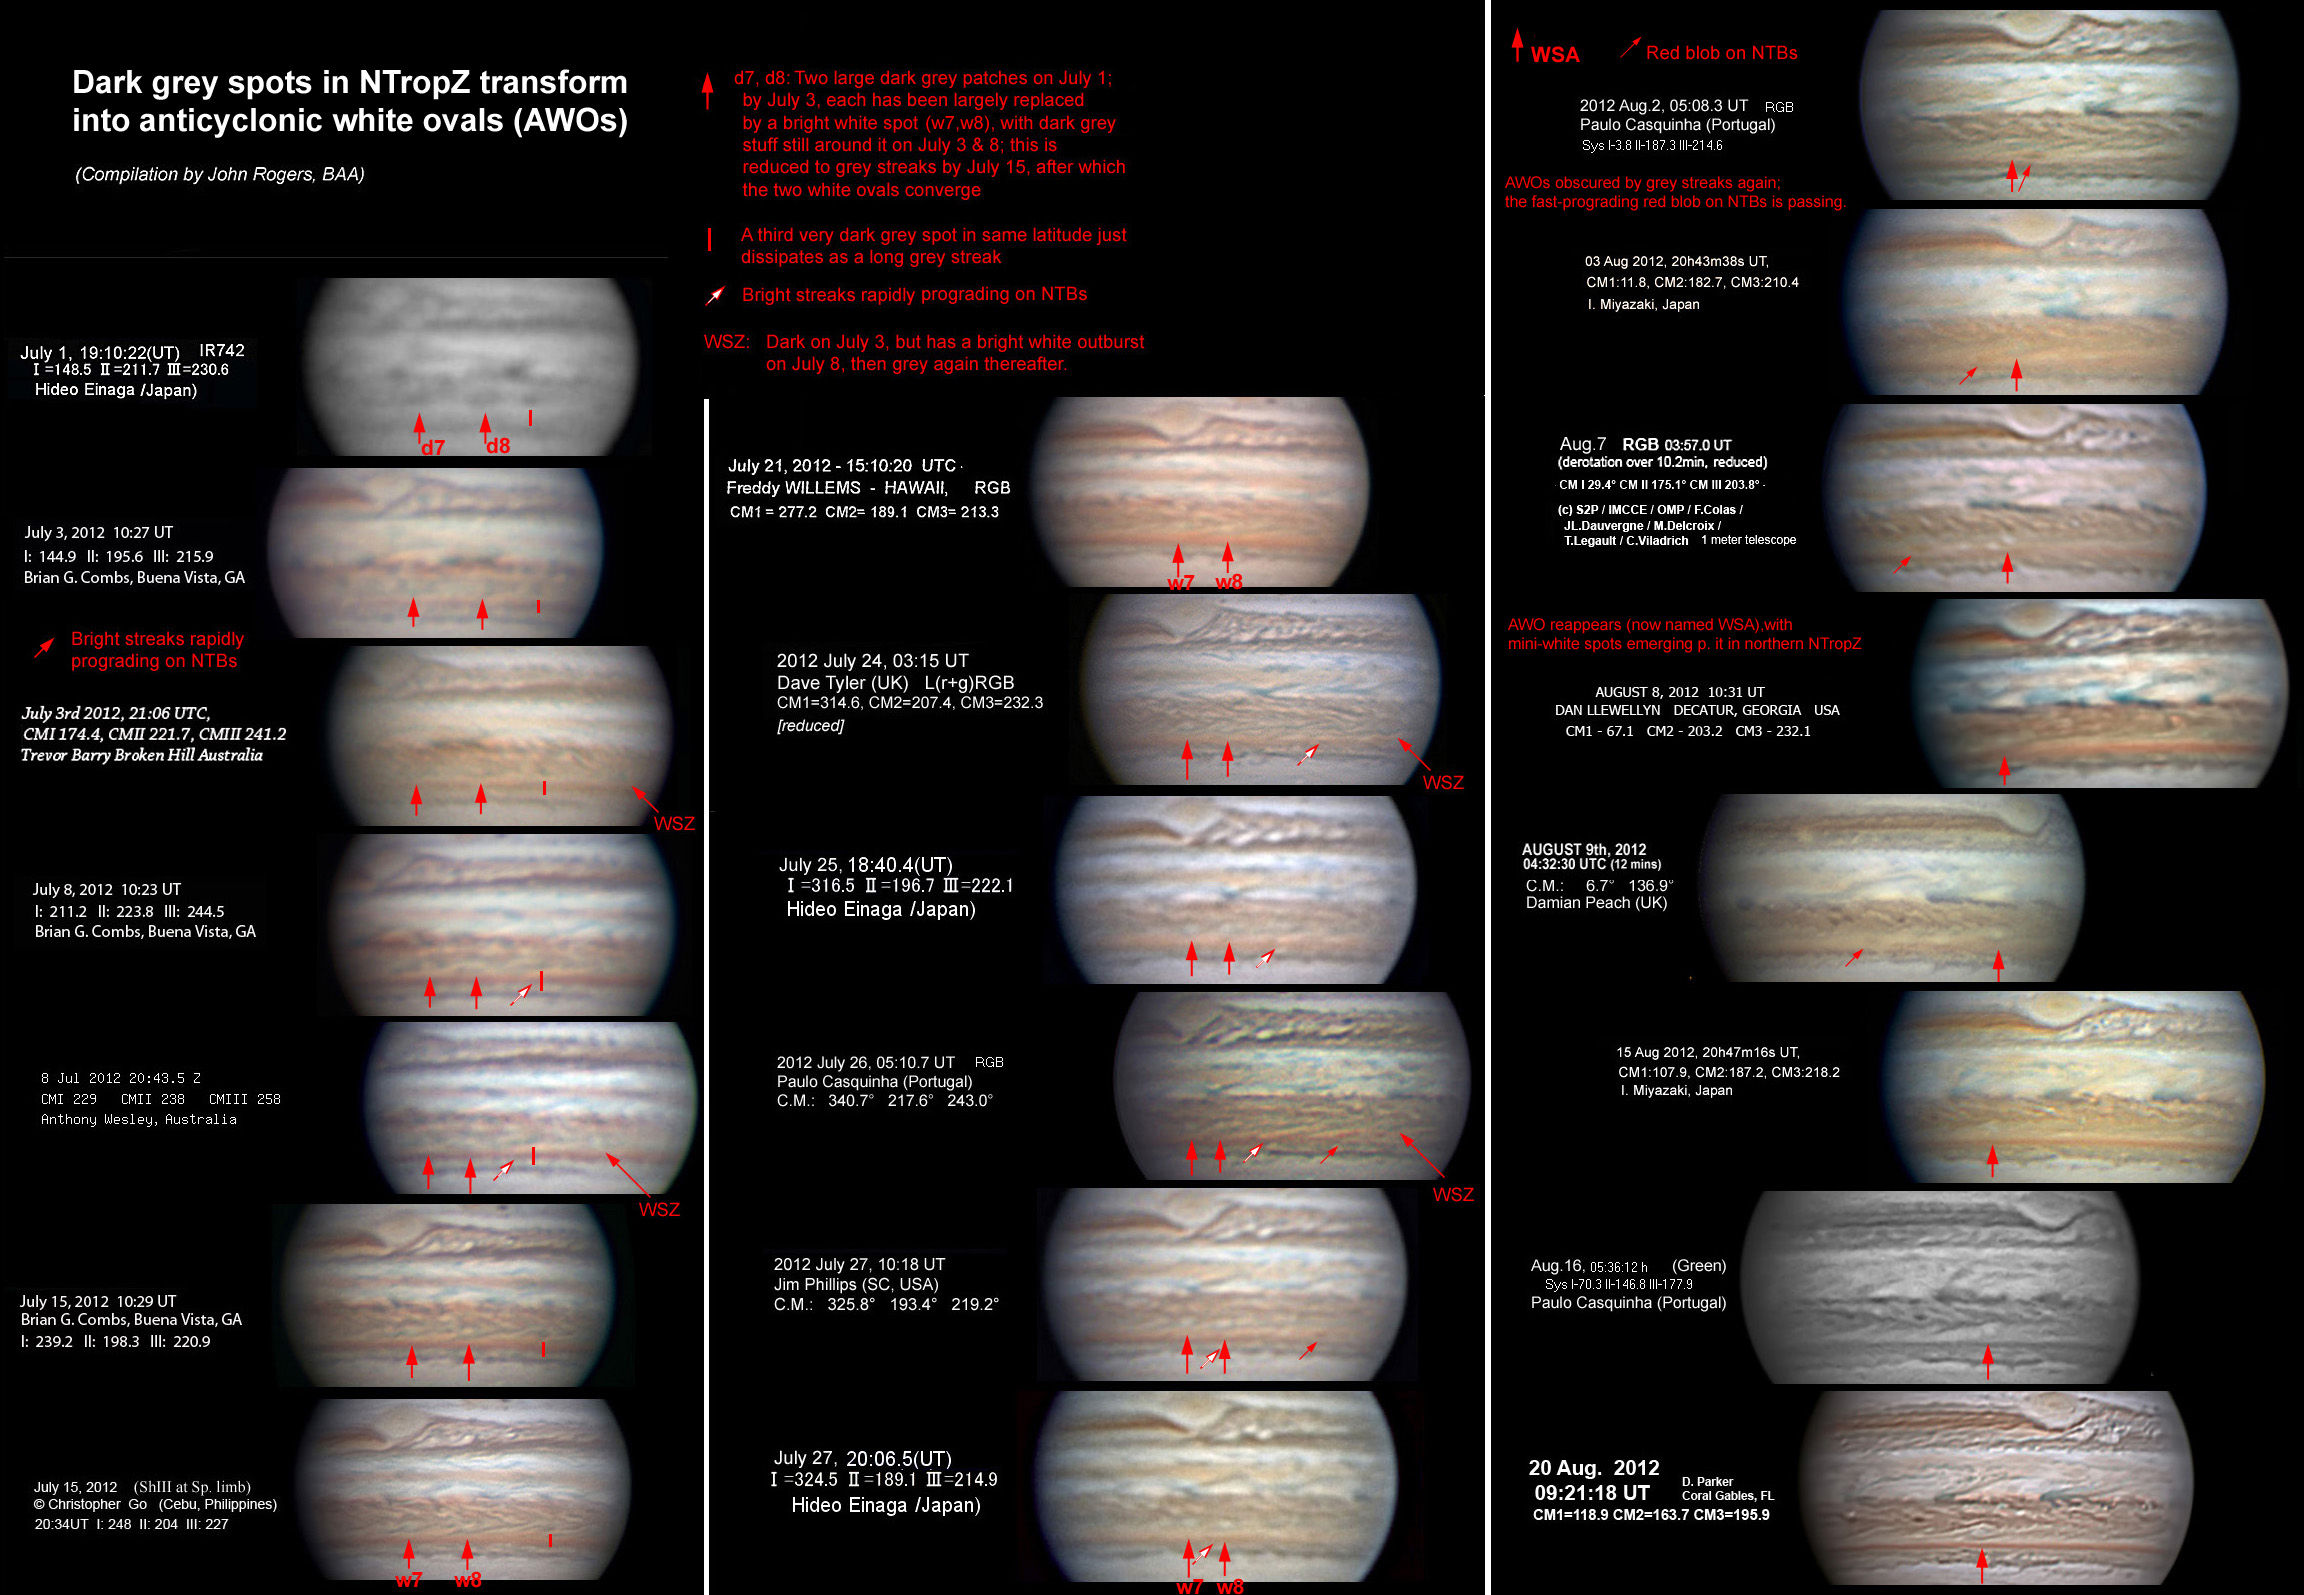
After a broadening or revival of the NEB, an array of cyclonic brown ovals (‘barges’) and anticyclonic white ovals (AWOs) normally forms. This has already begun, with several surprising aspects (Figs.5-7; Note 3):
i) At least one barge and one AWO seem to have survived from last year. The AWO is the well-known old White Spot Z (Fig.6b); but it was a dark grey spot in June, and is still largely shrouded in grey streaks.
ii) Some of the AWOs are actually transformations of the very dark grey spots seen in June! Of 5 such dark spots here named d4-d9, 3 or 4 were replaced by white spots, and detailed inspection of images shows what happened (Figs.5&6; Note 3). Spots d7, d8 and d9 were each replaced by a small white spot in early July, apparently displacing the dark grey material into streaks around it. However, these white spots were again masked by dark grey streaks later in July, only to reappear in August, drifting faster (White spots A and Z). Spot d4 disappeared around June 20, but it is suspicious that an AWO (White spot B) later appeared on the same track.
It is also notable that changes in appearance of these 3 AWOs occurred within days of each other, even though they were far apart.
This remarkable transformation of dark grey spots into white spots has not been documented before, to our knowledge, but it fits into what we know of these features. Dark grey or brown spots sometimes appear in the NTropZ in the early stages of a NEB broadening event or Revival, and are evidently anticyclonic rings; for instance, we documented several during the last broadening event in 2009. So no change in circulation is needed to convert them into AWOs. We may speculate that the very dramatic and rapid transformation in this year, along with the unusually early appearance of barges, could be related to the greater intensity of this full-blown Revival in contrast to more modest broadening events.
iii) A new array of barges as well as AWOs seems to be forming already in August, only 5 months after the start of the Revival (Fig.7). At least one brown barge (L2 ~ 125) could already be seen in mid-July and probably survived from last year. Others seem to be forming at L2 ~ 40, 70, and 140 (Fig.7). Like the white spots, they have begun very small, still buffetted by the surrounding turbulence, but nevertheless they are visible even in modest images.[Note 4] We can expect the array of barges and ovals to grow as the NEB settles down.
NTB(S):
By June the NTB(S) had already revived as a dark orange-brown belt (23 to 26 deg.N) around most of the circumference, as is typical after a super-fast outbreak. This was still very prominent in July, although there was still a short gap in it. Within this gap were indistinct grey streaks which could not be tracked, but we could obtain drift rates for several features flanking the gap, in the range DL1 ~ -30 to -69 deg/month [see Note 5 and Table 1].
Several findings confirm that a typical super-fast outbreak had occurred, even though the initial stage was only seen fuzzily for a few days in April, and no distinct spots remained after solar conjunction with super-fast speed (which would be DL1 ~ -5 deg/day). The following features are typical in the later stages, just as in 2007 [Ref.2]:
(i) The orange NTB(S);
(ii) The turbulence across the NTropZ;
(iii) A small reddish condensation within the belt on July 15 moved in L1 by ~-3 deg in 10 hours, confirming that the super-fast speed was present.
(iv) Speeds of DL1 ~-1 to -2 deg/day were observed [see Note 5 and Table 1]. These speeds are typical of the secondary phase of a super-fast outbreak [Note 4].
NTB(N):
A narrow dark grey NTB(N) exists all round the planet (29 deg.N to ~31-34 deg.N), but is discontinuous, with many streaks and wiggles. It is separated from the orange NTB(S) by a light strip which seems to show intense small-scale rifting in hi-res images (Fig.8). The JUPOS project has tracked many NTB(N) features at all longitudes, and they show typical N. Temperate Current drifts, DL2 = +16 to +29 deg/month. The speeds are much the same as last year, but the specific features are different. It will be interesting to see whether this belt becomes much more wavy and even develops into a N. Temperate Disturbance, as it did in the years after 2007.
NNTB:
The NNTB is essentially invisible, being replaced by a broad white zone from NTZ to NNTZ! This rare occurrence is no doubt another consequence of the great upheaval, in two respects. First, there seems to be a general tendency for increased darkening on one domain to be compensated by brightening in an adjacent domain [ref.3, p.248]. Second, the NTBs outbreak of 2007 seemed to suppress activity in the NNTBs jet-stream, and the same has now happened this year. (See discussion below.)
Zonal wind gradients:
Determing drift rates within this upheaval was difficult, given the low resolution of the early images and the complexity of the region, but our tracking of visibly identified features from June to August shows clear gradients of speed across the NEB and NTropZ which agree closely with the zonal wind profile from spacecraft (Fig.9). There may be some distortion of the NTBs jet peak, which we also found to be chaotic after the 2007 outbreak. Also, Grischa Hahn (personal communication) derived a zonal wind profile by map correlation analysis in WinJUPOS, using a pair of images on July 15, and although there are inevitable uncertainties in the result, it confirms that the zonal wind profile from the NEBs to the NTropZ has not changed.
Historical perspective and implications for global upheavals
[see Ref. 3, and our online reports since 2007]
i) Timing:
The coincidental timing of the NEB Revival and the NTBs outbreak [Note 6], which started only a month apart, is both satisfying and puzzling. It is satisfying because both occurred in line with previously established periodicities: 3-5 years for NEB expansion events (the last being in 2009, and the NEB Revival being an exaggerated version of one), and 5 years for NTBs super-fast outbreaks (the last being in 2007; previously, 1970-1990). But it is puzzling because there are no previous instances when both occurred together. NTBs outbreaks (whether super-fast or merely fast) tend to coincide with SEB Revivals, and with EZ coloration, constituting a Global Upheaval. NEB Revivals have never previously coincided either with NTBs outbreaks or with SEB Revivals, and are apparently unconnected to global upheavals. So if there is a connection - as the near-simultaneous outbreaks in adjacent domains strongly imply - it seems to be unique to this year.
ii) Coloration:
Reddish coloration is a typical (though not inevitable) consequence of all these major disturbances - SEB Revivals, NEB Revivals, and NTBs super-fast outbreaks - and it is often not restricted to the belt which revived, often spreading into adjacent zones [Ref. 3, p.55]. So it is no surprise that reddish colour has spread not only over the NEB and NTB(S), but also over the intervening NTropZ, and around part of the EZ. This is the first time we have had hi-res images of such a widespread coloration event, and they confirm that there really is diffuse colour across the NTropZ (e.g. Fig.8), which is not an artefact of low resolution. They also give a detailed view of the developing colour in the Equatorial Band.
Further understanding of the coloration may come from images being taken by amateurs and by professionals in various infrared bands. Ultraviolet and blue-light images may also be very useful in showing the development of the coloration event. (See the companion report no.4.)
iii) Suppression of NNTBs jet-stream activity:
The absence of NNTBs jet-stream spots is notable because they also disappeared immediately after the 2007 NTBs super-fast outbreak, suggesting that this may be a regular connection. Indeed, an historical survey confirms that NNTBs jet-stream spots were also absent for a full year after the NTBs super-fast outbreaks of 1970, 1975, and 1980, and virtually absent after the suspected NTBs outbreak of 1985 [Note 7]. The only exception to this rule was in 1990.
This connection adds to our understanding of global upheavals. As originally defined, a global upheaval typically included a NNTBs jet-stream outbreak starting a year or so after the NTBs jet-stream outbreak [Ref. 3, p.250]. However, the hi-res observations of recent decades have shown nearly continuous NNTBs jet-stream spot activity, although the number of spots varies, so ‘outbreaks’ of these spots are not as well-defined as previously thought. Possibly the real connection is that NTBs outbreaks (at least of the super-fast type) normally suppress NNTBs jet-stream activity, and what has often been observed is the re-appearance of normal activity a year or so later.
|
APPENDIX: NOTES
Note 1: Equatorial Band:
The p. end of the EB in late June was gradual, at L1 ~ 140-170, and the stretch up to L1 = 280 was quite dark brown. This was in the sector where NEBs projections were not yet well formed. As they did form, in July, the ochre EB cleared from this sector. At this time the p. end was quite well defined and drifted from L1 ~ 185 (early July) to 205 (late July) to 250 (mid-August). This behaviour may suggest that the ochre colour was cleared away by white plume clouds emanating from the NEBs; or it may just represent the usual drift rate on the equator. Conversely, at other longitudes pale reddish colour can sometimes be seen diffusing from the brown NEB (which is also observed at normal times).
The f. end in late June was at L1 ~20, in a short brown sector of EZ(N) (which covered NEBs projections 13-14; see Ref.1). After this faded away, there was a more irregular f. end around L1 ~45 (early July), which broke up and receded to L1 ~ 0 (late July to mid-August).
Note 2: NEBs:
The JUPOS chart suggests that the new NEBs dark spots (nos.6-10) appeared or stabilised in order of increasing L1, as though they were induced when passing a specific sector of NEB (from DL2 ~210 in early July to ~140 in late July). However there were no distinct rifts or other features at this location that might be responsible.
From late July onwards, the JUPOS chart for mid-NEB does show a pair of bright streaks that were moving with DL1 = +4.1 deg/day (DL2 = -3.6 deg/day) , but in a different longitude sector.
The NEBs dark spots were at ~8 deg.N, and the NEBs edge itself was unusually far north at 9 deg.N.
Note 3: Spots in NTropZ:
The dark grey spots in June, at 18-19 deg.N, were at L2 ~ 109 (here named d4), 219 (d8), 274 (d9), and 359 (a long bar, d5/d6); and a less conspicuous one at L2 ~ 193 (d7). The JUPOS chart (Fig.5) implies that 3 or 4 of these 5 dark spots were replaced by white spots, and detailed inspection of images shows what happened (e.g. Fig.6). Spots d7, d8 and d9 were each replaced by a small white spot in early July, apparently displacing the dark grey material into streaks around it. However, these white spots were again masked by dark grey streaks later in July, only to reappear in August, moving faster than the original dark spots. Spot d4 seemed to be sheared apart on June 20 and was not seen thereafter, but it is suspicious that an AWO (White spot B) appeared on the same track on Aug.4.
Streak d5/d6, though, was indeed subject to the zonal shear and evolved into rapidly changing grey spots or streaks, which could not be tracked for more than a few days. The best-established speed for any of these was DL2 ~ -84 deg/montn, but a wide range of speeds may have been present in this shear zone.
The AWOs which replaced spots d7 and d8 seemed about to merge when they were shrouded in grey streaks at the end of July, and only one re-emerged on Aug.7 (White spot A: Fig.6a). Both WSA and WSB have usually been small light spots, embedded in oblique streaks, but they both brightened on Aug.17, and briefly looked like white plumes (Fig.7).
The AWO which replaced spot d9 was the well-known old White Spot Z (Fig.6b). White spot Z first appeared in 1997 after an earlier NEB broadening event, and has always been the fastest-moving AWO in the NTropZ. Now it has accelerated to the remarkable speed of DL2 = -31 deg/month. It was identified by each of the JUPOS measurers independently during their analysis of July images. It had a brief white outburst on July 8, but then became dark grey again. It became lighter again at the start of August, but still still remained an obscure grey lozenge surrounded by grey streaks (Fig.6b) - exactly the same aspect that it had in 2007 June after the NTB outbreak [Ref.2, inc. Fig.29] before it recovered its usual brightness.
Note 4: NEBn barges:
Other barges may be forming at other longitudes. For instance, the JUPOS measurements reveal two small dark spots in August (L2 ~ 305 and 324, drifting to L2 ~ 288 and 306), with mean DL2 ~ -32 deg/mth and latitude 14 deg.N, both of which were decelerating and drifting north, i.e. becoming more like typical barges.
Note 5: Features tracked around the gap in the NTB(S):
(4a) At the f. end of the gap, the p. end of the dark orange-brown NTB has been sometimes tapered but often distinct enough to give a definite drift rate, DL1 = -69 deg/month [Table 1].
In 2007, there was a very similar p. end to the red-brown NTB at the same stage of the outbreak, with DL1 = -31 deg/month [Ref.2].
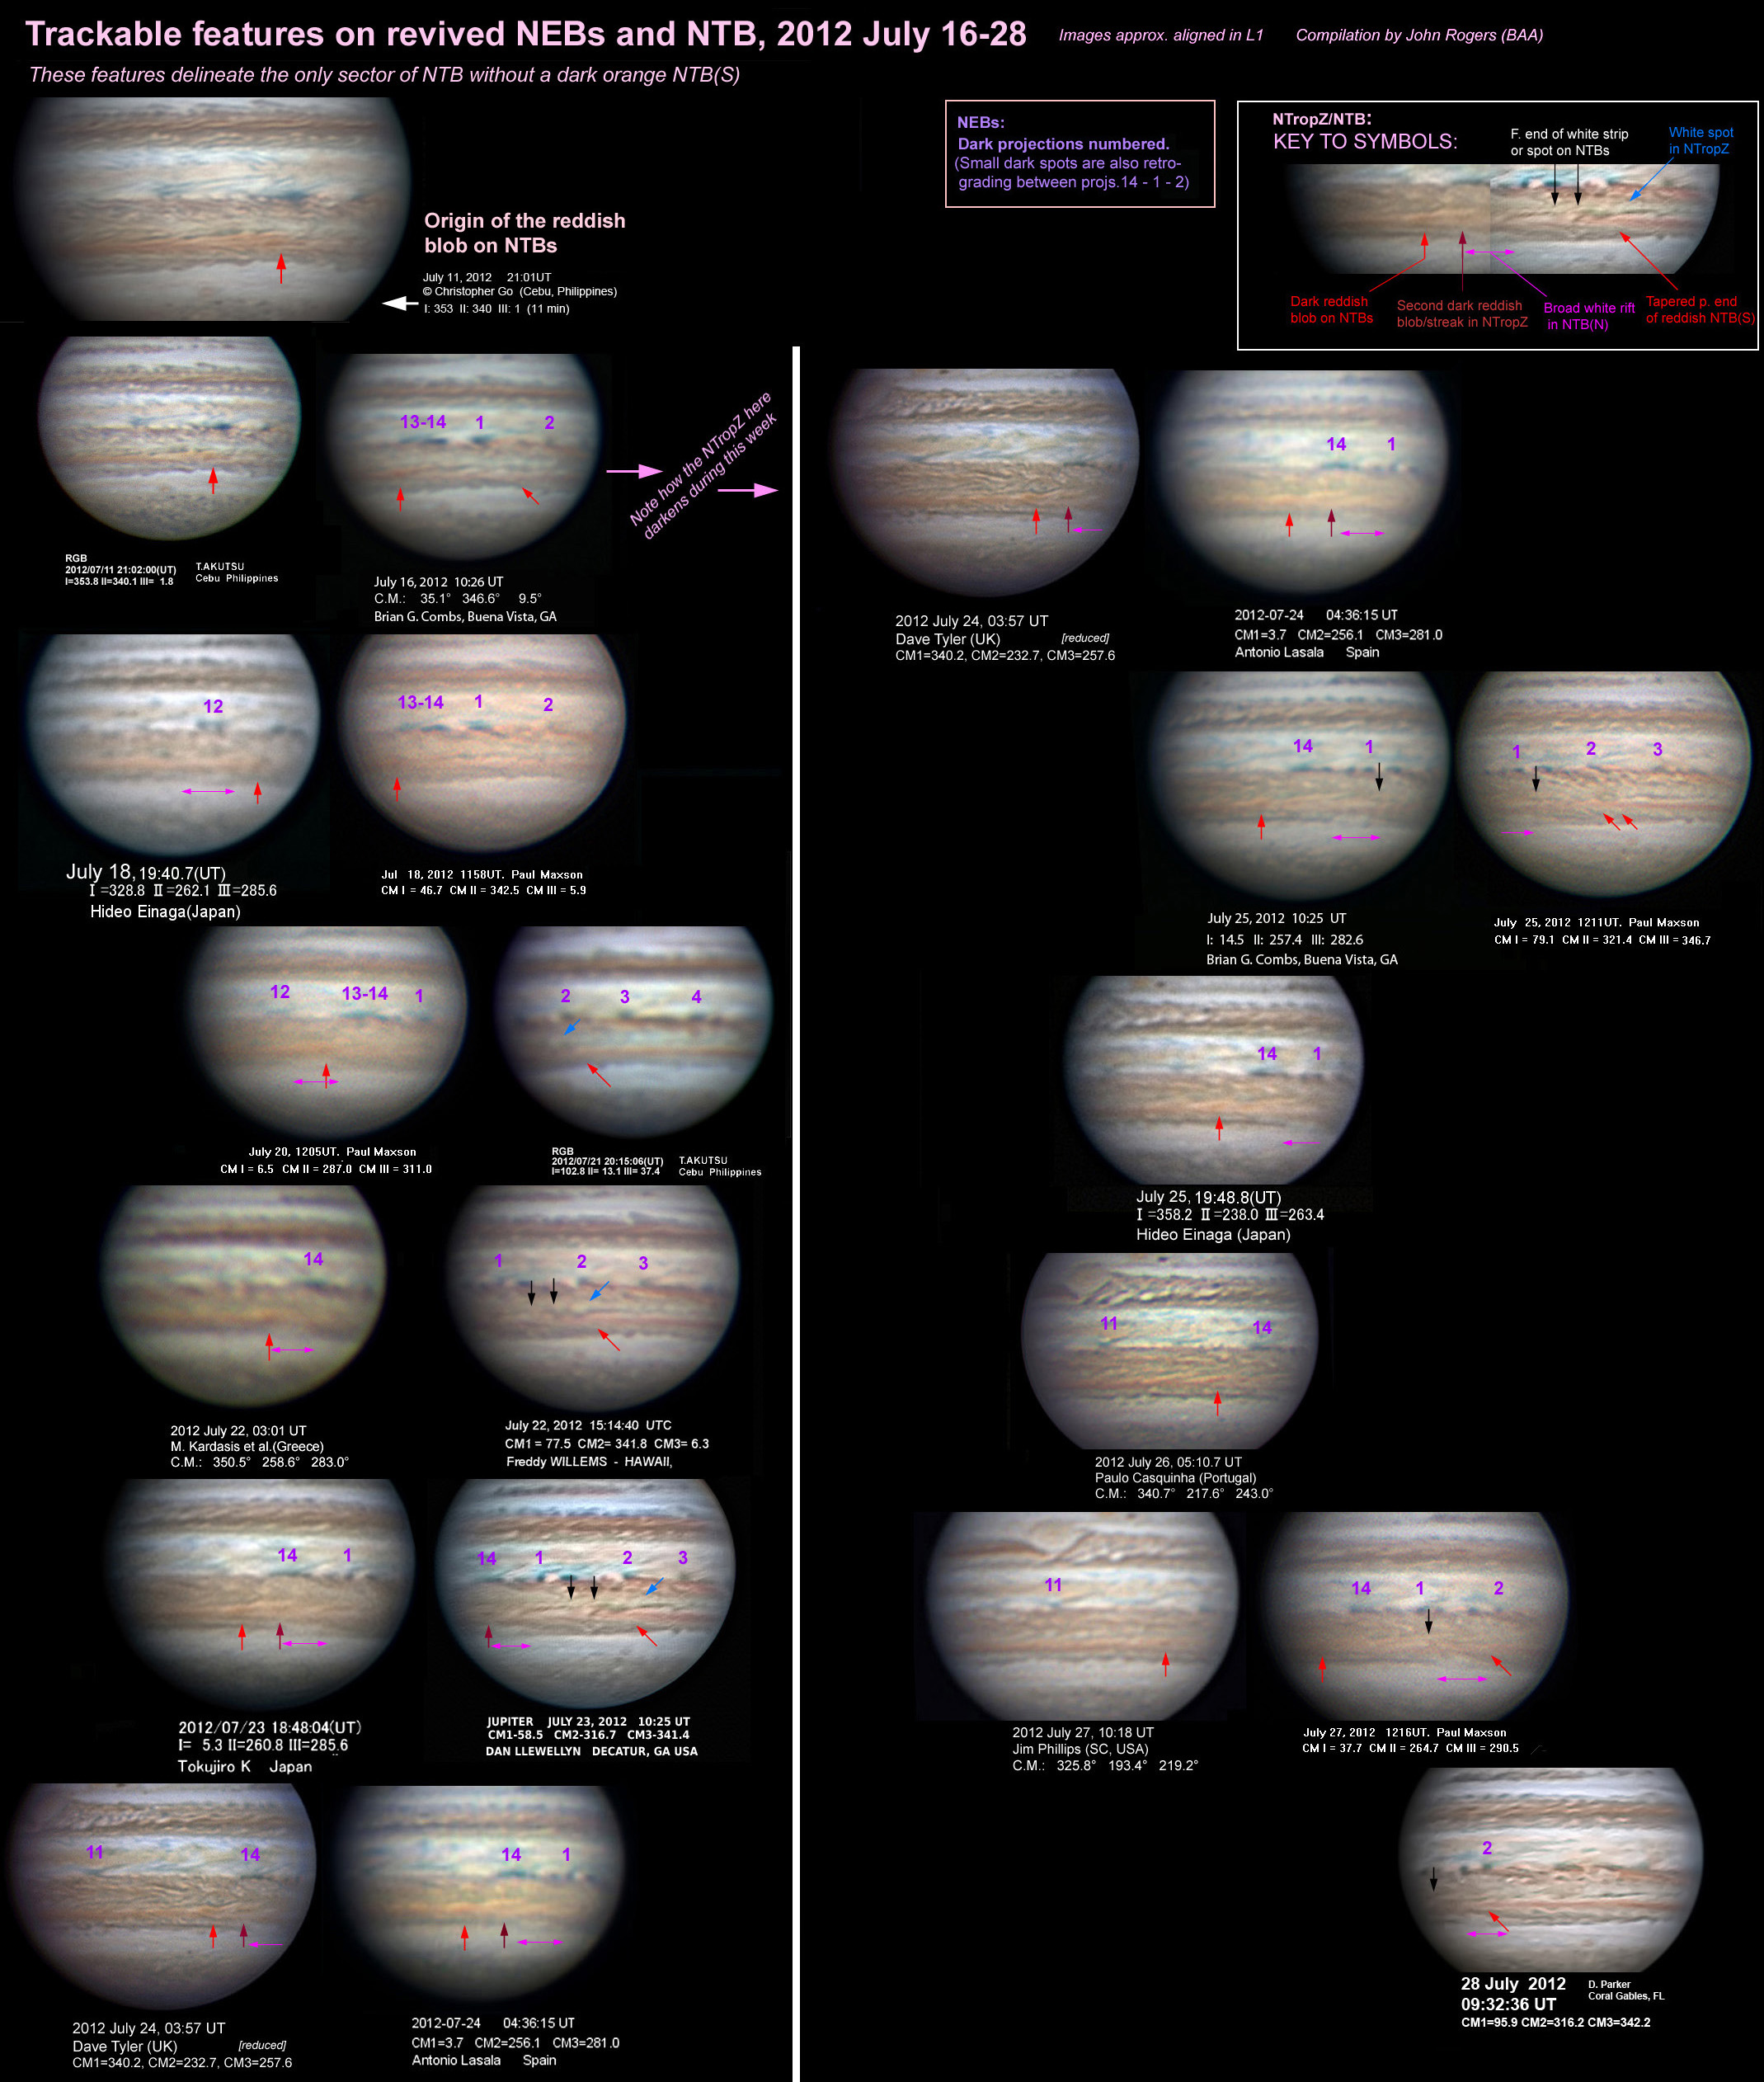
(4b) Near the p. end of the gap, the NTBs was disturbed in early July, producing a reddish streak on July 11 (Fig.4), which gradually formed a notable reddish blob on the NTBs (Figs.4&7) [Table 1]. It had DL1 ~ -30 deg/mth in late July, but as it continued to round up and shift southwards, it decelerated to DL1 ~ +23 (+/-11) deg/mth in early August, just south of the NTBs. It was presumably an anticyclonic oval, whose modest speed represented its latitude south of the jet peak.
Similar reddish ovals have been recorded:
-- in 1964 (on the S edge of the new orange NTB(S) which had formed without any distinct outbreak being observed; DL1 = -53 deg/mth); &
-- in 2008 (pale ‘lozenges’ within the orange NTB(S) after the 2007 outbreak; DL1 = -78 deg/mth).
(4c) On the S edge of the gap, the f. end of a small white strip had DL1 ~ -44 deg/mth. This also may owe its modest speed to its latitude on the south side of the jet peak.
Similar speeds are normally recorded for many dark spots in super-fast outbreaks, but were probably missed this time during solar conjunction. Thus dark spots were recorded in 1975 with DL1 = -41, in 1990 with DL1 = -25, and in 2007 with DL1 = -24 (range -11 to -31, plus two with -58) [Refs.2 & 3] - all much slower than the super-fast bright plumes that define the outbreaks.
Note 6: NTBs outbreak, NTB Revival?
It is tempting to refer to the NTB event as a “NTB Revival”, as it has involved the revival of the dark NTB this year and in other recent instances, and this may indeed be a typical manifestation. However, such outbreaks in the past have not always been preceded by fading of the NTB, and the NTB has often faded and revived without any jet-stream outbreak being observed [Ref.3, p.101ff]. So for now I refer to this event as a “NTBs super-fast jet-stream outbreak” (or “NTBs outbreak” for short), because its defining feature is the appearance of spots with the super-fast jet-stream speed, i.e. DL1 = -5 deg/day (u3 ~ 170 m/s, N. Temperate Current D). It is a characteristic event that also produces slower-moving dark spots, a strongly reddish NTB(S), suppression of the NNTBs jet-stream activity, and perhaps other attributes as discussed in our reports since 2007. It is different from the historical NTBs jet-stream outbreaks which had more modest speed, DL1 = -2 deg/day (u3 ~ 125 m/s, N. Temperate Current C), with a different type of spots, and did not produce reddish coloration nor suppress NNTBs jet-stream activity.
Note 7: Suppression of NNTBs jetstream activity by NTBs outbreaks:
The dates of onset of the NTBs super-fast outbreaks, and the appearance of NNTBs jet-stream spots thereafter, were as follows.
1970 August: No NNTBs jet-stream spots were seen thereafter, nor in 1971, even though there had been plenty up to 1970 July.
1975 Sep.: None in 1975 nor 1976.
1980 May: None in 1980/81.
1985 (suspected outbreak during solar conjunction early in the year): Just one spot in 1985, and 4 tiny ones in 1986, recorded mainly from the Pic du Midi.
1990 Feb.: The exception. A substantial outbreak of NNTBs jet-stream spots started in 1990 Jan. and continued at least until March, and was still continuing (after solar conjunction) from Dec. onwards. So there was probably no suppression of these spots, unless for a brief period during solar conjunction. This was also the only NTBs super-fast outbreak which did not produce substantial reddish colour.
|
Jupiter in 2012/13: Interim report no.3
レポート:木星北半球の大変動の2012年7月~8月の進捗状況
Progress of Jupiter’s great northern upheaval, 2012 July-August.
September 20, 2012
John Rogers (BAA) & Gianluigi Adamoli (JUPOS team)
2012年、木星は隣接したドメインに起こった、NEBとNTBの復活からなる、2つ同時の大アウトブレーク(outbreak)という前代未聞の光景を示している。両方のoutbreakは太陽との合の直前に始まり、その見えない期間にほとんど発達したが、6月に木星が再び現れた時に劇的な攪乱(disturbance)は明らかであった【文献1】。現在、木星が高く昇るにつれて良くなった画像によって、またJUPOSチームからのチャートやマップによって、何が起こっているかを示す鮮明な画像を得ている。このレポートは7月と8月上旬をカバーする。執筆時点では、8月下旬で攪乱領域は落ち着いているように見える。だから、さらに結果が出るかもしれないけれども、これが現代では先例のない攪乱の主要なレポートになるだろう。
このレポートは、テキストが主に概要と議論になり、付録(注釈1-6)と表1が詳細になるように整理されている。7月全体の北半球のマップは図1になり、木星全体の最近のマップが図2である。異なる波長での緯度測定とともに、紫外や赤外の画像は同封されているReport no.4に記載されている。
NEBは1926年以降初めての本格的な復活がまさに進行していて、NTBは2007年に最後に見られたような超高速ジェット気流のoutbreakによってまさに復活している。6月にはまだ明るかったベルトのセクターや間のNTropZは、現在は強い乱流と赤味がかった色(黄土色またはオレンジ色)で満たされ、NEBsからNTBまでの一つの幅広い茶色と黄土色のベルトを形成している。大きな噴出は終わったように思われ、このような現象のいつものように、攪乱は大規模から小規模まで発達し、7月末までに全体の領域は小さなストリークで満たされた。高解像度画像では、これらは領域全体に風勾配を示す、目立った杉綾模様(herring-bone)を形成している。隣接するドメインも影響を受けていて、NNTBはほとんど消失し、黄土色の赤道ベルト(Equatorial Band)は赤道の半分に伸びている。
説明
赤道帯(Equatorial Zone):
淡い黄土色のEBは今シーズンの注目すべき模様であり、何かしらNEB復活と関係しているのは間違いない。EBは緯度で南北約2度に分かれ、青灰色のストリークと混じっている。全周のおよそ半分だけに存在していて、短くなっている【付録の注釈1を参照】が、同様な色の淡いパッチは他の経度に存在している。
高解像度画像の研究から、この現象についてもっと学んだかもしれない。赤味がかった色の発生源を同定できるか?それが存在していないところでは、まだ拡がっていないからなのか、あるいは一掃されているからなのか?
EZ北部とNEB南部:
NEBの明るいセクターが埋めて、7月初めにはNEB全体が明るい茶色になり、乱れたストリークで埋められたが、はっきりとしたリフトはなかった。ベルトの半周には、多くの非常に濃い青味がかった灰色の暗斑(典型的なプロジェクション)を運ぶ、暗いNEB(S)があって、7月末までにベルト全体に拡がった【注釈2】。
これらのNEBsの暗斑ははっきりとしていて安定であった。3-4月の最初のNEBs暗斑は大きなプラスのDL1を示していたのに対して、7-8月にはこれらの暗斑は通常のドリフトである平均DL1=+5度/月、範囲-7~+15度/月を示した【図3】。8月上旬までに、全周に13の安定した暗斑の並びがあった。主な活動は14,1,2番の暗斑の間であって、DL1=約+0.5~+1.6度/日で後退する【図4】、新しく小さな非常に濃い短命な暗斑を産み出すように、繰り返し分裂した。この挙動はNEB内部の強烈な攪乱と並んで典型的であり、NEBs上か近くに暗斑を生成して部分的に流れに乗せて運ぶ傾向がある。
7月のNEB内に、ユビキタスな(偏在する)小規模の乱流があったが、目立ったリフトも明るい白斑もなかった【注釈2を除く】。明るい白斑は8月下旬に再出現した(たとえば図2、おそらく通常の活動の再開を示している)。
NEB北部と北熱帯(N.Tropical Zone):
6月には、異なるセクター間に大規模なコントラストと、NTropZのほぼ固定されたL2にいくつかの非常に濃い灰色の暗斑があったが、7月上旬まで目立った大きな模様は持続しなかった【図2】。これらの緯度(北緯18-21度)に散らばる多くの暗いパッチがあったが、急速に変化していた。後の7月には、主な濃い灰色の模様は、NTropZ北部(北緯20-22度)を斜めに横切り、風の速度勾配を示している、無数のストリークであった。(同様な筋状模様は2007年のNTBs outbreak後でも見られ、それでこれはoutbreakのどちらかか、あるいは両方が関係しているかもしれない)。一方、NTropZも次第にくすんだ黄土色の陰影で埋まり、灰色のストリークの杉綾模様(herring-bone)と混じってきた。NTropZの筋状模様が少ないセクターでは、低解像度と関係しないで、はっきりとした拡散する色があることが高解像度画像で確認された【たとえば図8】。
NEBの拡幅や復活の後には、低気圧性の茶色の暗斑(バージ)や高気圧性の白斑(AWO)の並びが通常は形成される。これは、いくつかの驚くべき様相とともにすでに始まっている【図5-7、注釈3】。
i) 少なくとも一つのバージと一つのAWOは昨年から生き延びていると思われる。AWOは良く知られている古い白斑Z(WSZ)である【図6b】。しかし、これは6月には濃い灰色の斑点だったが、なおもほとんど灰色のストリークに囲まれている。
ii) いくつかのAWOは実際に6月に見られた非常に濃い灰色斑点の転換である。d4-d9と名付けた5個の暗斑のうち、3個あるいは4個は白斑と置き換わり、画像を詳しく見ると何が行っているかが分かる(図5,6、注釈3)。暗斑d7,d8,d9はそれぞれ、どうやら周りのストリークが濃い灰色物質に取って代わり、7月上旬に小さな白斑と置き換わった。しかしながら、これらの白斑は7月以降に再び濃い灰色ストリークで隠されて、より速いドリフトで、8月に再出現した(白斑Aと白斑Z)。暗斑d4は6月20日頃に消失したが、後でAWO(白斑B)が同じ航跡に出現したのは怪しい。
また、これら3個のAWOは、離れていたにも関わらずに、それらの外観の変化がお互いに数日以内に起こったことは注目すべきである。
白斑への濃い灰色暗斑の注目すべき転換は、知っている限り、これまで文書化されていないが、転換はこれらの様相を知ることと適合している。濃い灰色や茶色の暗斑はNEB拡幅現象や復活の初期段階でNTropZに時々出現し、明らかに高気圧性リングである。たとえば、2009年に我々は最近の拡幅現象を文書化した。だから、循環気流に変化がないことが暗斑を高気圧性白斑に変換するために必要である。今年の非常に劇的で急速な転換は、異常に早いバージの出現とともに、もっと穏やかな拡幅現象とは対照的に、本格的な復活のより大きな強さに関係しているだろうと推測される。
iii) 高気圧性白斑と同様のバージの新しい並びは、復活の開始のわずか5ヵ月後の8月にはすでに形成されているように見える(図7)。少なくとも一つの茶色のバージ(L2=約125度)は7月中旬にすでに見えていただろうし、おそらく昨年から生存しているだろう。他のバージはL2=約40,70,140度に形成されているように見える(図7)。白斑のように、バージは非常に小さくなり始め、今も周りの乱流にもまれているが、にも関わらずにバージは中程度の画像でさえ見えている[注釈4]。我々はNEBが静かになった時にバージや白斑の並びが成長することを期待している。
北温帯縞南部(NTB(S)):
6月までに、NTB(S)はすでにほとんど全周に渡って濃いオレンジ-茶色のベルト(北緯23-26度)が復活しているが、これは超高速outbreak後の典型である。その中にまだ短いギャップがあるけれども、7月にはベルトはまだ非常に目立っていた。このギャップ内部には追跡できない不明瞭な灰色のストリークがあったが、我々は、ギャップに隣接するいくつかの模様について、DL1=約-30~-69度/月の範囲のドリフトを得ることができた[注釈5と表1]。
初期段階では4月の数日間に不明瞭にしか見えなくて、太陽との合の後では超高速の速度(DL1=-5約度/日)を持つはっきりとした白斑はなかったにも関わらずに、いくつかの所見から典型的な超高速outbreakが発生したことが確認された。以下の様相は2007年のようなその後の典型的な段階である[文献2]:
(i) オレンジ色のNTB(S);
(ii) NTropZを横切る乱流;
(iii) 7月15日に10時間でL1が-3度移動したベルト内部の赤味がかった小暗塊、これによって超高速の速度が存在することを確認した。
(iv) DL1=-1~-2度/日の速度が観測された[注釈5と表1]。これらの速度は超高速outbreakの典型的な第2段階である[注釈4]。
北温帯縞北部(NTB(N)):
狭く濃い灰色のNTB(N)が全周に存在している(北緯29度~約31-34度)が、多くのストリークや揺れ動くもの(wiggle)があって不連続である。高解像度画像では小規模な強いリフトのように見える明るい細片(strip)によって、NTB(N)はオレンジ色のNTB(S)と分離している[図8]。JUPOSプロジェクトでは全ての経度で多くのNTB(N)の模様を追跡しているが、それから典型的な北温帯流(N. Temperate Current)のドリフトがDL2=+16~+29度/月であることが分かった。速度は昨年と同じであるが、特定の模様は異なっている。2007年以降に見られたように、このベルトがさらに波状になって、北温帯攪乱(N. Temperate Disturbance)に発達するかどうか興味深い。
北北温帯縞(NNTB):
NNTBは、NTZからNNTZまで幅広い白帯に置き換って、基本的に見えない。このまれな出来事は2つの点で、大変動の別な結果に間違いない。第一に、隣接したドメインの明化によって補償されるように、一つのドメインの暗化が増加することが一般的な傾向であるように思われる[文献3,p248]。第二に、2007年のNTBs outbreakはNNTBsジェット気流の活動を抑制するように思われ、同じことが今年に起こっている(以下の議論を参照)。
帯状風の勾配:
初期画像の低分解能と領域の複雑さから、この変動内部のドリフトを決定することは難しいが、7月から8月に目に見えて識別された模様の追跡によって、探査機からの帯状風プロファイルにとても一致する、NEBとNTropZに渡る速度勾配を示す[図9]。2007年のoutbreakの後にカオスであることを発見した、NTBsジェット気流ピークの歪みがあるかもしれない。また、Grischa Hahn氏(私信)は、7月15日のペア画像を用いて、WinJUPOSのマップ相関解析によって帯状風プロファイルを導き出した。結果に必然的な不正確さがあるけれども、NEBからNTropZの帯状風プロファイルは変化していないことが確認された。
大変動の歴史的視点と影響
[参考: 文献3と2007年以降の我々のレポート]
i) タイミング(Timing):
たった1ヵ月離れて始まった、NEB復活とNTBs outbreakの偶然のタイミング[注釈6]は、満足と不可解の両方である。両方がこれまでに確立された周期性【3-5年毎のNEB拡幅現象(最近は2009年であり、NEB復活はその誇張されたバージョンである)、5年毎のNTBs超高速outbreak(最近は2007年である、過去には1970-1990年)】と一致して発生したので満足している。しかし、両方が同時に起こった過去の例がないので不可解である。NTBs outbreak(超高速か単に高速かは問わない)は、SEB復活やEZ着色と同時に起こる傾向があり、大変動を構成している。NEB復活は以前には決してNTBs outbreakやSEB復活と同時に起こらなかったので、大変動とは明らかに関連性はない。それで、もしも関連性があれば、隣接ドメインでのほぼ同時のoutbreakが強く示すように、今年はユニークであるように思われる。
ii) 着色(Coloration):
赤味がかった着色はこれらの主な攪乱【SEB復活、NEB復活、NTBs超高速outbreak】全ての典型的な結果(必然ではないけれども)であり、着色は隣接したゾーンにしばしば拡がって、復活したベルトに限定されない[文献3,p55]。だから、赤味がかった色が、NEBやNTB(S)のみならず、間のNTropZや一部のEZにも拡がっていることは驚きではない。これはこのような広く拡がった着色現象の高解像度画像を得た最初であり、NTropZに低分解能の人工物ではない実際に拡散色があることが確認されている(たとえば図8)。また、これらから、赤道バンドに拡がる色の詳細を見ることができる。
着色のさらなる理解は、様々な赤外バンドでアマチュアやプロによって撮影された画像による。紫外や青色光画像も、着色現象の発達を示していて、非常に有用かもしれない(対をなすreport no.4参考)。
iii) NNTBsジェット気流の活動の抑制:
2007年のNTBs超高速outbreakの直後に、NNTBsジェット気流暗斑も消失したことから、これらに通常の関連性が示唆されて、NNTBsジェット気流暗斑の欠如は注目される。確かに、歴史の調査によれば、NNTBsジェット気流暗斑も1970年、1975年、1980年のNTBs超高速outbreak後の1年間は存在しなかったし、また1985年の疑わしいNTBs outbreak後に実際には存在しなかった[注釈7]。このルールの唯一の例外は1990年であった。
この関連性は大変動の我々の理解に加わる。当初に定義されたように、大変動は典型的に、NTBsジェット気流outbreakの後の1年かそこらで始まるNNTBsジェット気流outbreakを含める[文献3,p250]。しかしながら、暗斑の数は変化するけれども、ここ数十年の高解像度観測から、ほぼ連続したNNTBsジェット気流暗斑の活動が見られて、これらの暗斑のoutbreakは以前の考えほど良く定義されていない。おそらく、NTBs outbreak(少なくとも超高速タイプ)が通常はNNTBsジェット気流の活動を抑制するということが実際の関連性であり、さらにしばしば観測されていることは1年かそれ以上の通常の活動の再出現である。
|