Jupiter in 2012: Report no.4Multispectral imaging of the EZ and NTB coloration eventsSeptember 20, 2012
| ||||||||||||||||||||||||||||||||||||||||||||||||||||||||||||||||||||||||||||||||||||||||||||||||||||||||||||||||||||||||||||||||||||||||||||||||||||||||||||
|
Japanese
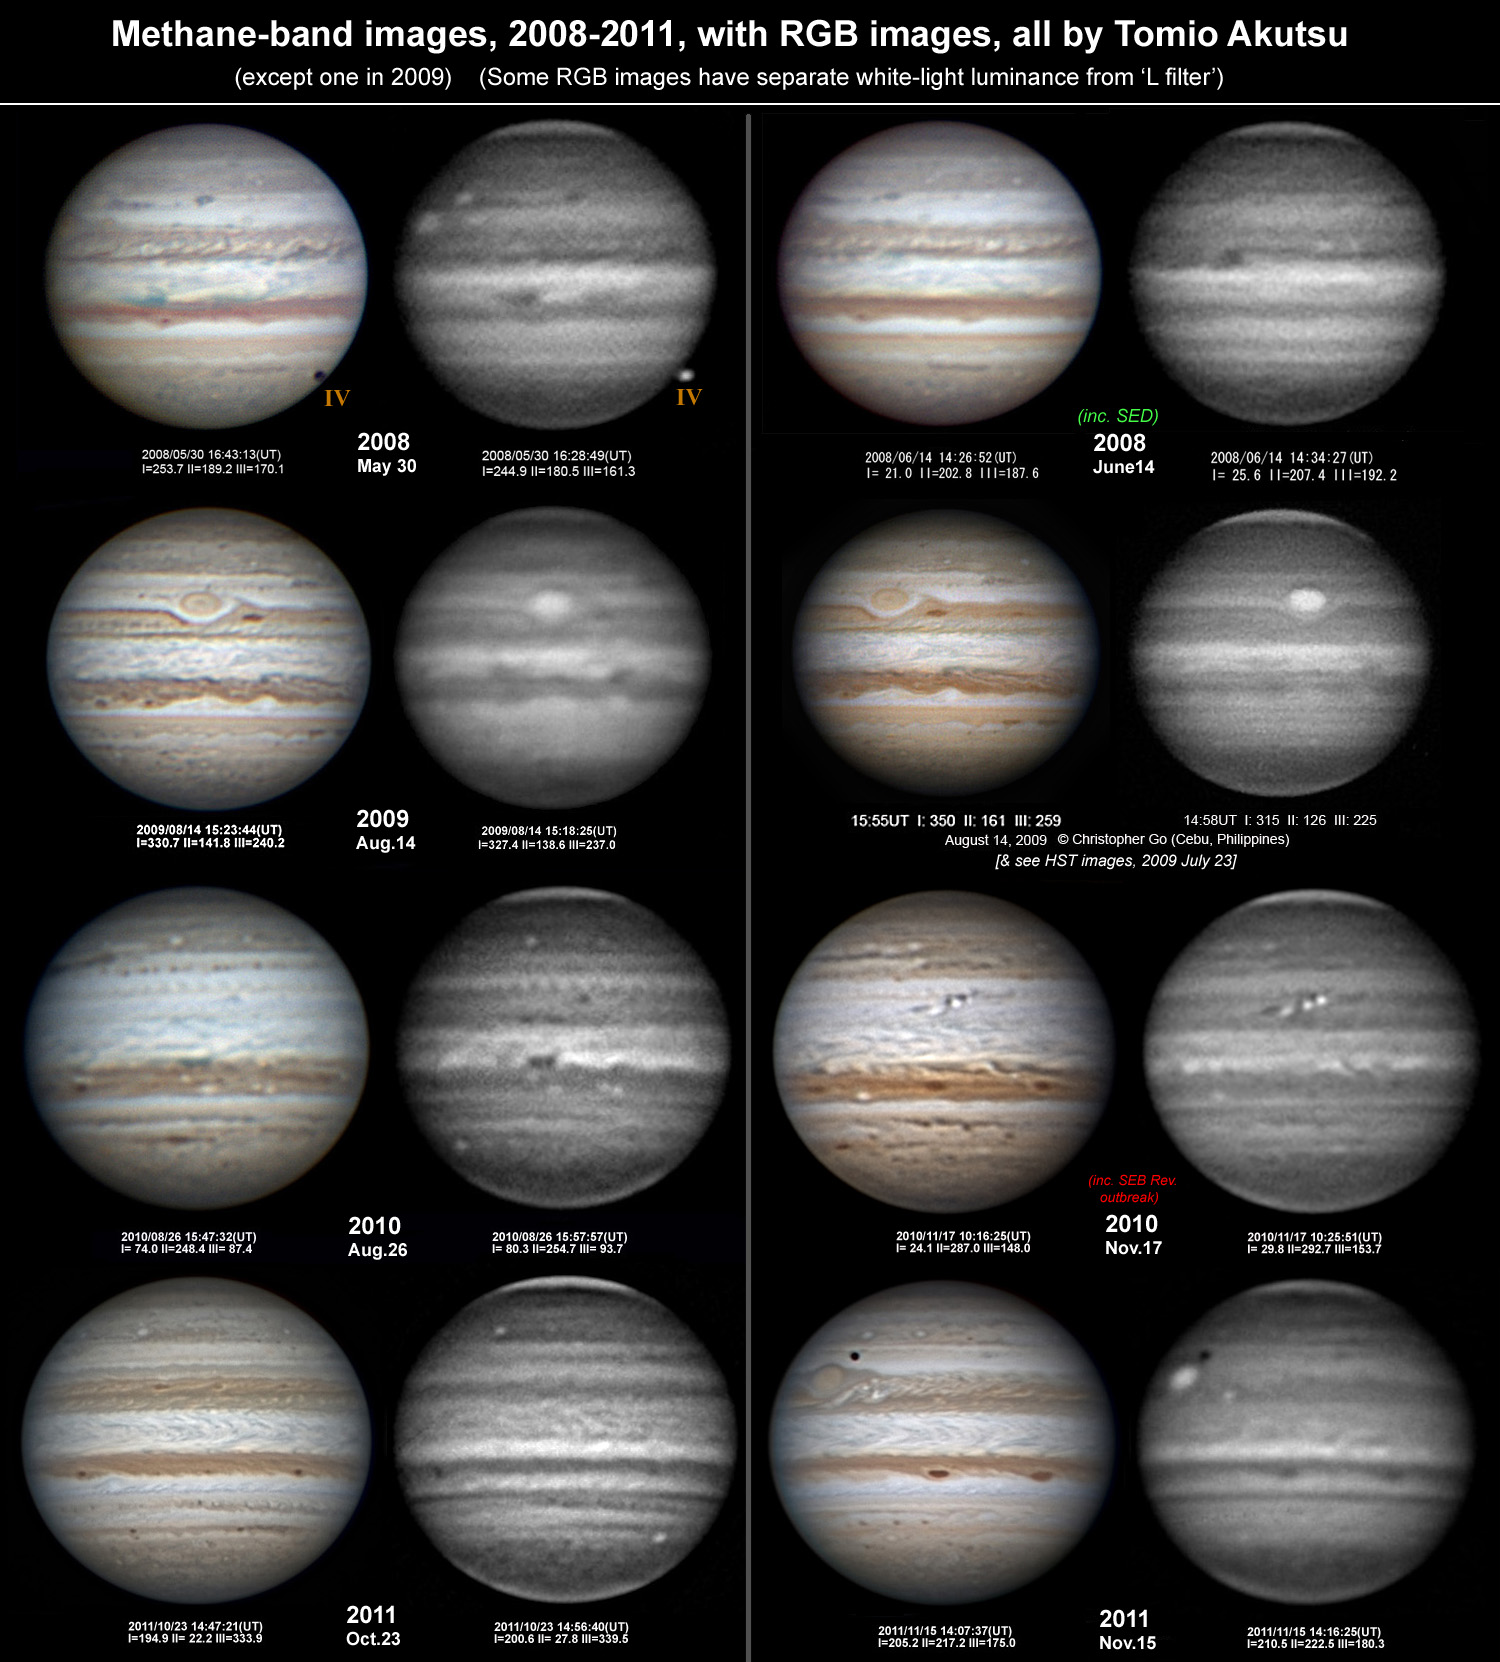
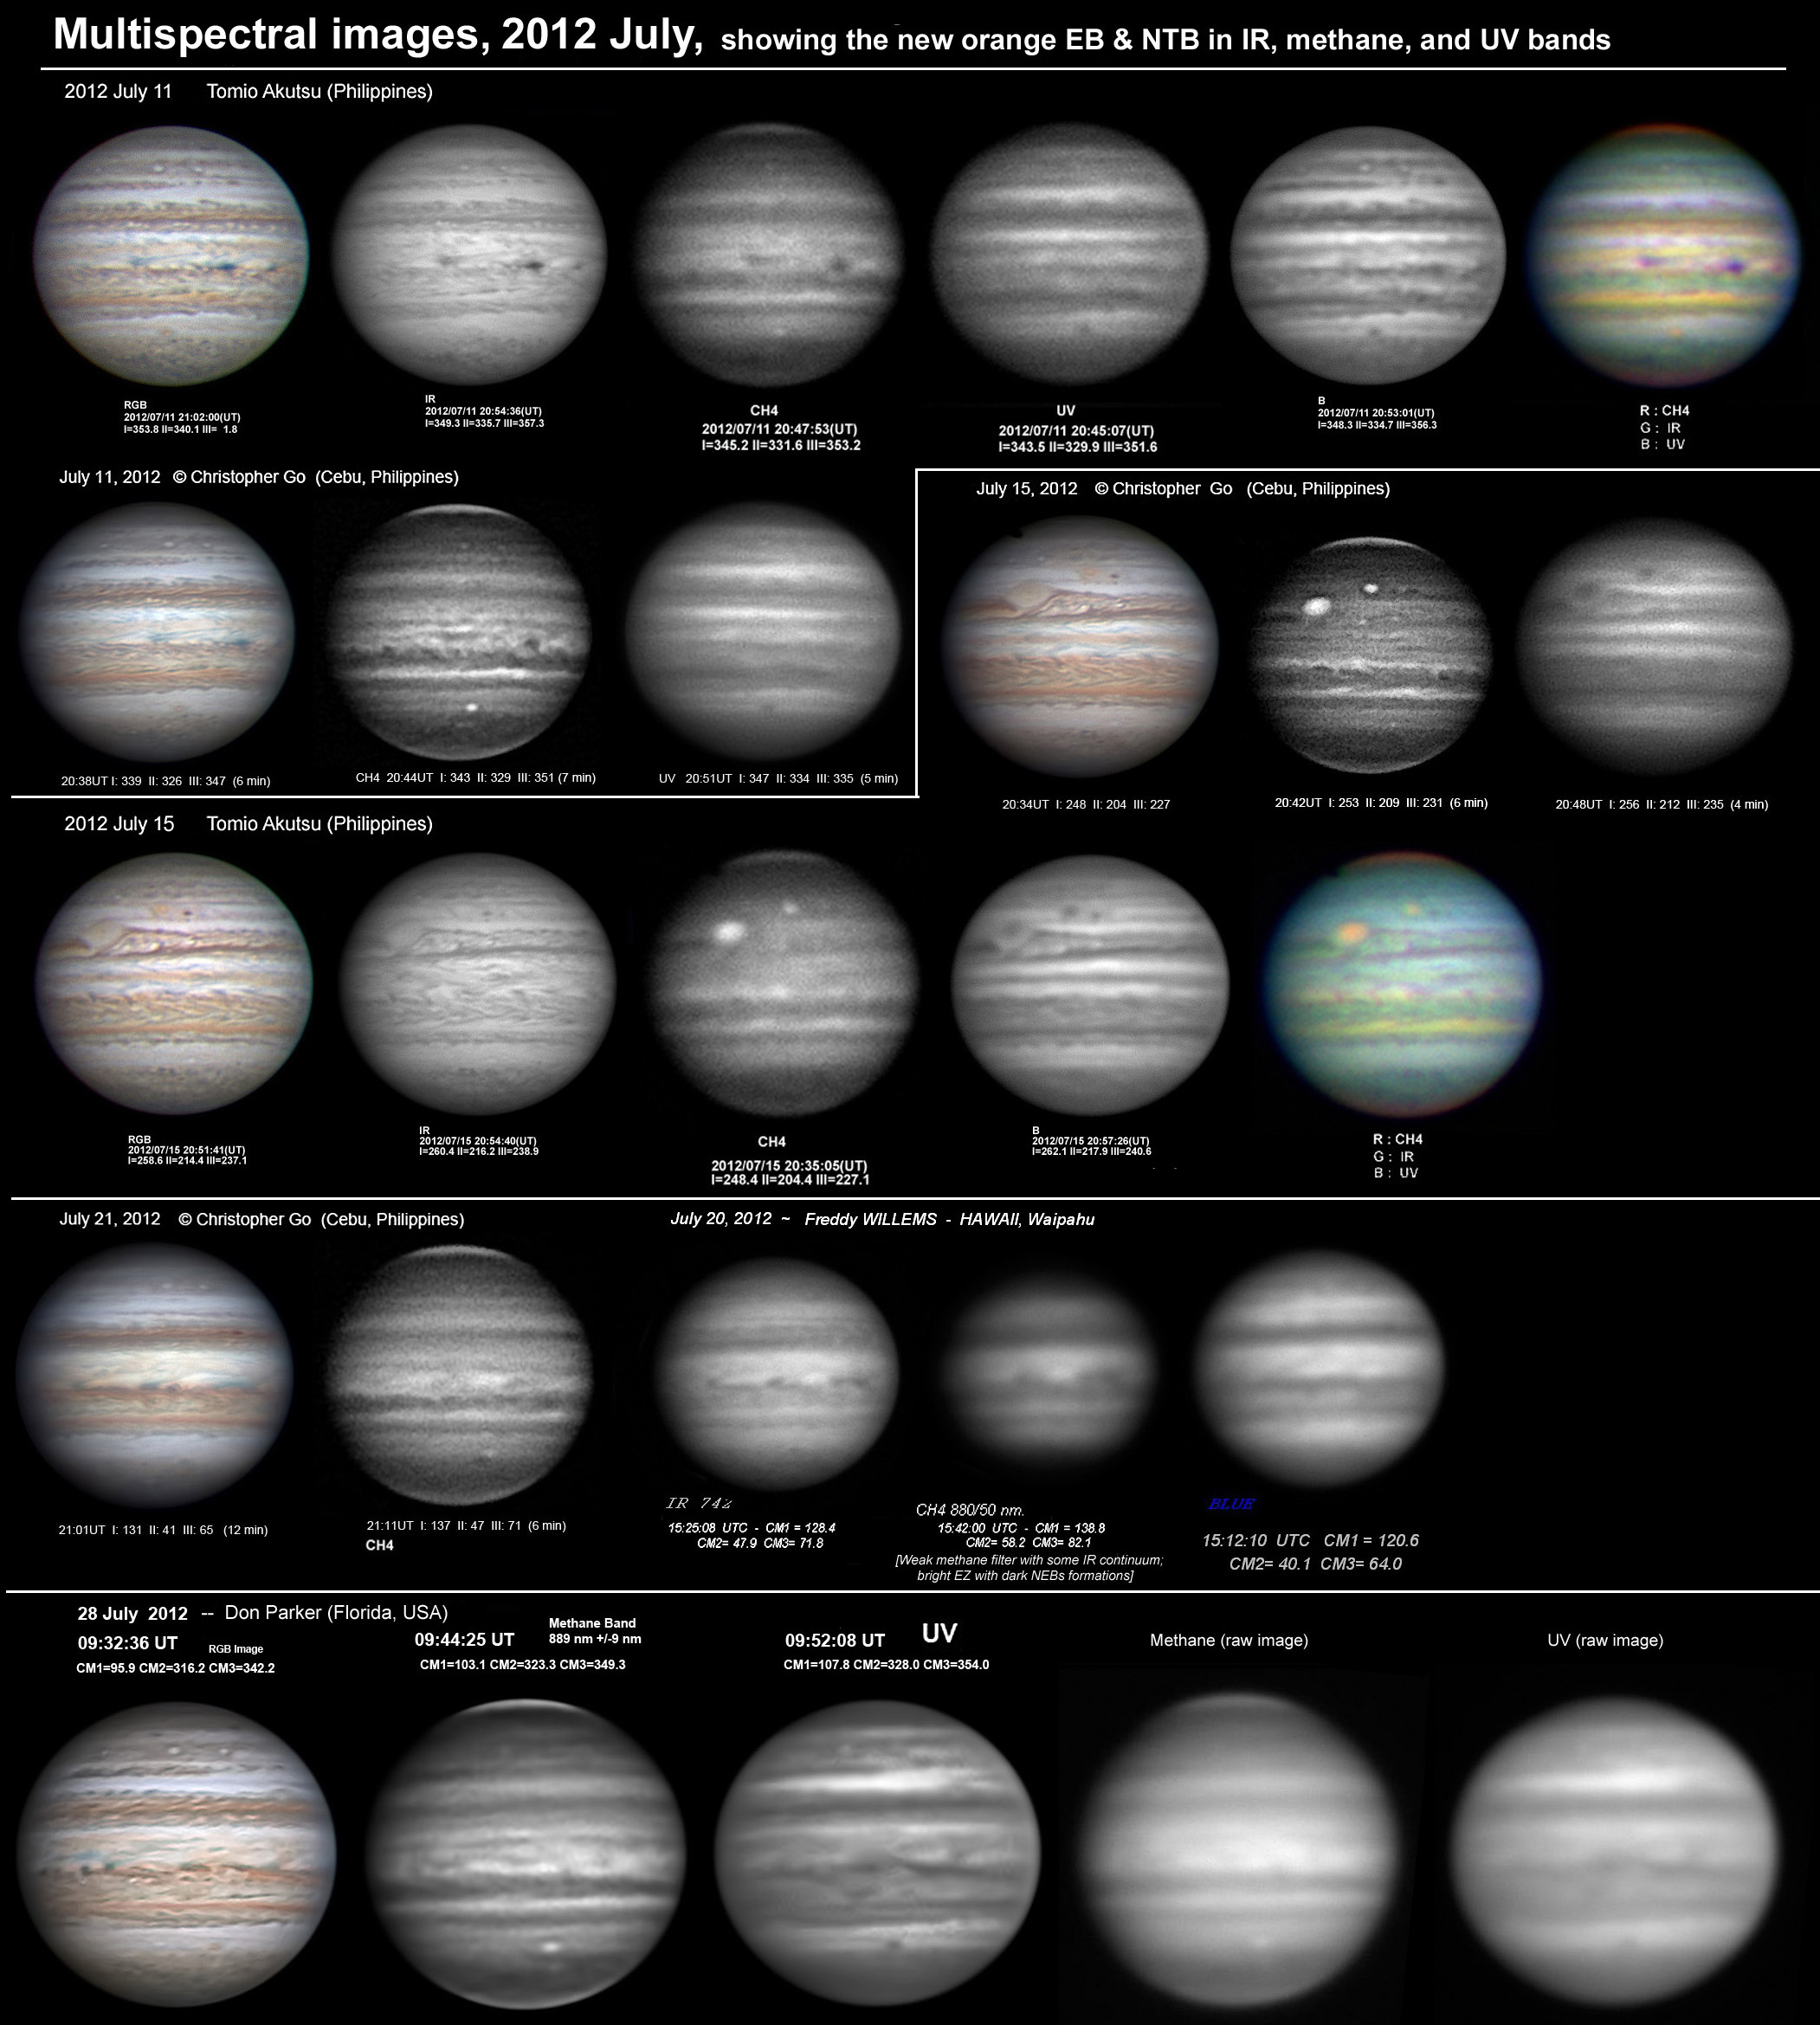
This is a preliminary account of multispectral images in 2012, especially in the methane absorption waveband at 889 nm. These images can give important information on the different cloud layers on Jupiter. Methane-band images from 2012 June have been posted with our Report no.1. Herewith is a montage of images from 2012 July (Fig.3), plus some v-hi-res ones from the Pic du Midi in early August (Fig.4). This account also puts them into the context of methane images over the past 5 years (Fig.2) (and we are posting a similar account for 2007 as the latest item in the ‘Reports, 2007’ pages on this web site). The special interest this year is the widespread coloration event, and especially the strong reddish colour on the EB and the revived NTB(S). The paradigm (dating back to similar coloration events in the earliest years of methane imaging in 1968-72) is that reddish colour is due to a high-altitude haze, which is thus bright in methane images. In 2007 and 2012, we have the chance to investigate how far this paradigm is consistent with modern hi-res imaging. We find that it is not very consistent after all. This is only an interim account, as we have not had time to compile or assess multispectral images systematically in recent years. Any conclusions are subject to confirmation from more thorough analysis that would also assess the different selectivities of different methane-band filters. If any of the multispectral imagers would like to compose any reports themselves on these images, they would be very welcome. Images are taken in various wavebands from ultraviolet (UV) to infrared (IR), especially in the methane absorption waveband (CH4). UV images are very sensitive to reddish colours, which appear dark as they are produced by enhanced absorption of UV and blue light (which may represent spreading into the visible spectrum of the omnipresent absorption of UV light by thin haze). Methane images show high clouds and hazes as bright, because they are above most of the methane absorption in the atmosphere. Because the planet is so dark in UV and methane wavebands, exposures have to be long and these images have comparatively low resolution, even with modern technology. In contrast, images in the IR continuum or I-band (~740 nm to 1 micron) have plenty of light, reflected from the visible cloud-tops or slightly deeper, and reddish features are bright in red or IR light. The EZ and EB in methane images
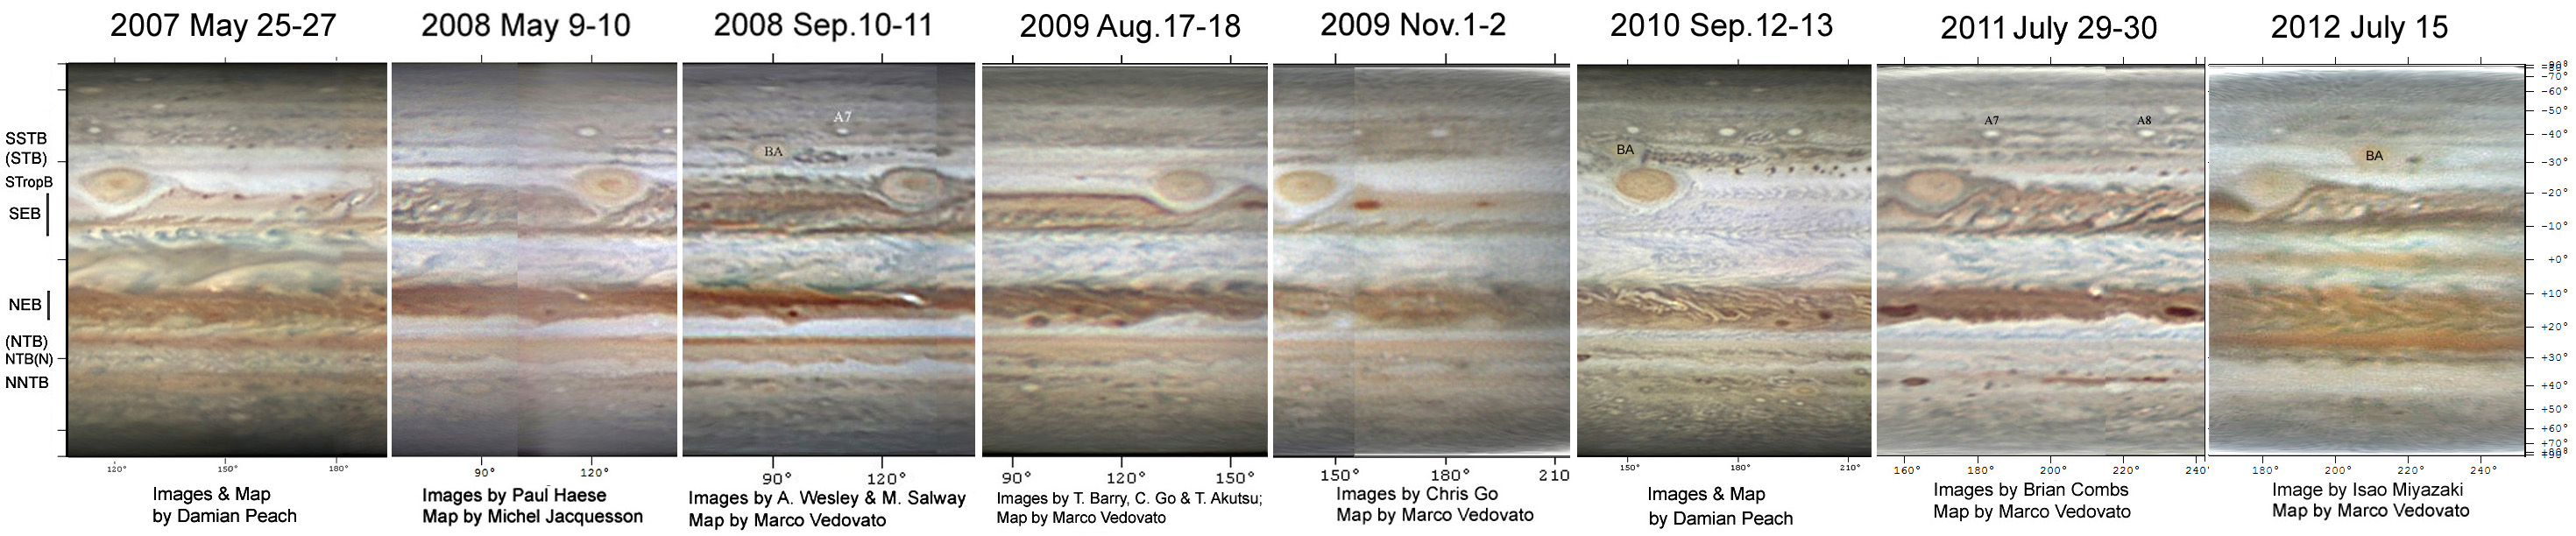
There is usually a methane-bright haze overlying much or all of the width of the EZ, but its boundaries do not coincide exactly with those of the visible EZ, and it appearance is controlled by several largescale variations: In 2007, dark grey-brown shading filled much of the EZ, which I interpreted as a coloration event associated with the global upheaval of that year, since it seemed to be different in colour and extent from the blue-grey streakiness that more commonly appears in association with the festoons from the NEBs. Indeed, multispectral images showed that it was UV-dark and methane-bright, consistent with a high-altitude reddish haze. However its greyish-brown colour suggested that it was accompanied by clearing of deeper clouds. The gradual changes since 2007 can be seen in Fig.2, a sample of methane-band images by one observer from 2008 to 2011. In 2007, most of the EZ was methane-bright. In 2008 and 2009, the EZ(N) became duller in methane, indicating increasing disruption of the haze layer. (The dark NEBs ‘projections’ were then methane-dark as well, even though they were not always prominent visually; in many previous years, these features have been obscured by the methane-bright haze.) In 2010, the whole EZ was much less methane-bright than usual, and in 2011 the pattern had reversed, so that now the a strip of EZ(N) was methane-bright while all the rest was dull. This pattern is still seen in 2012, although even EZ(N) has many methane-dark streaks. Moreover, the methane-bright EZ(N) extends several degrees over the visibly dark NEBs (see Table 1), which is quite common though unexplained. Thus the new orange EB is surprisingly quite dark in methane. It is not uniformly so: the darkest parts coincide with blue-grey streaks along its edges, as though these streaks are very methane-dark while the orange haze itself is methane-transparent.
In UV images, as expected, the new orange EB is notably dark, and even the sector which is not strongly coloured visually is fairly dark in UV. The order of darkness of belts in UV appears to be approximately:
The NTB in methane images
The methane-dark NTB was still present in its usual latitudes in the years up to 2007 when the NTB was visibly whitened. It approximately coincided with the canonical latitudes of the NTB between the NTBs and NTBn jetstreams, suggesting that the high-altitude haze is controlled more by the dynamical pattern than by weather changes in the main cloud layers. In 2010 and 2011, as the reddish NTB faded to become merely a pale strip, a narrow methane-dark NTB(S) reappeared, but it coincided with bluish streaks in the NTropZ (23N) rather than the canonical NTB(S) - as though methane-bright haze still obscured the middle part of the NTB. With the NTB revival in 2012, the major part of the NTB is again methane-dark (25-32N; Table 1), including the central strip which now appears to be visibly bright due to micro-scale rifting. However, the new orange NTB(S) (23-26N) overlaps the methane-dark NTBs edge (25N); i.e. the southern part of the NTB(S) is methane-bright, but the northern part is not. This is consistent with the same stage in 2007, showing that the new reddish NTB(S) in its early stages is not necessarily methane-bright. Along itse northern edge, either the haze is so thin as to be methane-transparent, or it lies deeper than expected. We may expect it to wholly methane-bright over the coming months, as it did in 2007-2008. Conclusions
Overall, there is not a strong correlation between the visible colour and methane brightness.
| ||||||||||||||||||||||||||||||||||||||||||||||||||||||||||||||||||||||||||||||||||||||||||||||||||||||||||||||||||||||||||||||||||||||||||||||||||||||||||||
|
Table 1. Latitudes of belt edges in UV, visible, and methane bands.
Zenographic latitude measurements were made by Gianluigi Adamoli on 8 multispectral image sets between July 11 and August 10, taken by T. Akutsu, C. Go, D. Parker, and by M. Delcroix et al. at the Pic du Midi; and also on visible-light images by F. Willems and D. Peach. Some outlying values are omitted. Blue and UV images gave indistinguishable results and are grouped together. @Values in boxes appeared to be bimodal. For NEBs in RGB images, low latitudes represent S edge of long dark streaks. For NTBn in UV and blue images, the edge is very undulating. The large scatter for the NEBs in methane images indicates true variability between ~10 and 13N.
| ||||||||||||||||||||||||||||||||||||||||||||||||||||||||||||||||||||||||||||||||||||||||||||||||||||||||||||||||||||||||||||||||||||||||||||||||||||||||||||
|
Figures
 Click to original size
 Click to original size
 Click to original size
 Click to original size 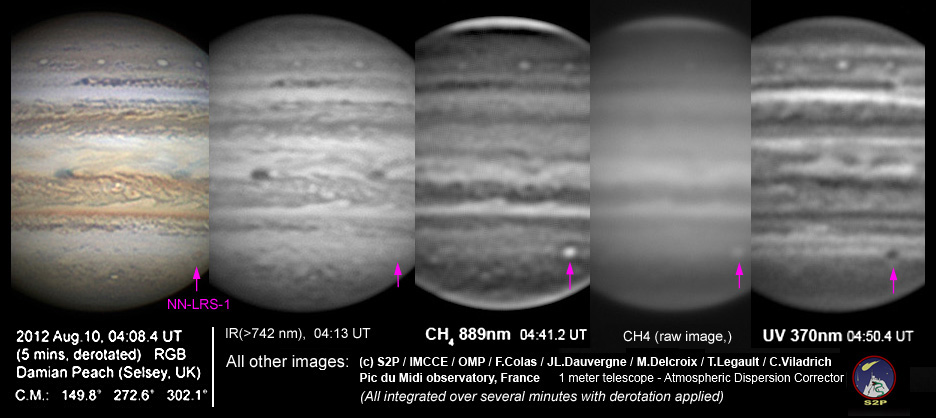 Click to original size
| ||||||||||||||||||||||||||||||||||||||||||||||||||||||||||||||||||||||||||||||||||||||||||||||||||||||||||||||||||||||||||||||||||||||||||||||||||||||||||||
|
John Rogers (British Astronomical Association), 2012 Sep.20
| ||||||||||||||||||||||||||||||||||||||||||||||||||||||||||||||||||||||||||||||||||||||||||||||||||||||||||||||||||||||||||||||||||||||||||||||||||||||||||||
|
_______________________________
| ||||||||||||||||||||||||||||||||||||||||||||||||||||||||||||||||||||||||||||||||||||||||||||||||||||||||||||||||||||||||||||||||||||||||||||||||||||||||||||
Jupiter in 2012: Report no.4EZとNTBの着色現象のマルチスペクトル画像
| ||||||||||||||||||||||||||||||||||||||||||||||||||||||||||||||||||||||||||||||||||||||||||||||||||||||||||||||||||||||||||||||||||||||||||||||||||||||||||||
|
これは2012年のマルチスペクトル画像、特に889nmのメタン吸収バンドの予備的報告である。これらの画像は木星の異なる雲レイヤーの重要な情報を与える。2012年6月以降のメタンバンド画像は我々のReport no.1に公開している。これとともに2012年7月以降の画像の合成(図3)と、さらに8月上旬のPic du Midiの超高解像度画像(図4)がある。また、この報告は過去5年間のメタン画像の内容を追加している(図2)。(BAAのwebサイトの"Reports, 2007"ページの最新項目として、同様な2007年の報告を公開している。) 今年の特に興味深いことは、拡がった着色現象と特にEBや復活したNTB(S)の強い赤味がかった色である。実例としては(1968-72年のメタン画像の最も早い年の同様な着色現象に遡る)、赤味がかった色は、メタン画像で明るい高高度ヘイズが原因である。2007年と2012年の、この実例がどれぐらい現代の高解像度画像と一致しているかを研究する機会である。これはずいぶんと一貫性がないことが分かる。 近年、体系的にマルチスペクトル画像を整理したり、評価したりする時間がなかったので、これが唯一の中間報告である。いかなる結論も異なるメタンバンド・フィルターの異なる選択性も評価するという徹底的な解析からの確認を必要としている。マルチスペクトル画像撮影者がこれらの画像をレポートに使いたいならば、歓迎する。 画像は、紫外線(UV)から赤外線(IR)までの様々の波長で、特にメタン吸収バンド(CH4)で撮影されている。UV画像は赤味がかった色に非常に敏感で、それはUVと青色光の吸収を強調するので暗く見える(薄いヘイズによってUV光の偏在吸収が可視光スペクトルに拡がっていることを表わているかもしれない)。メタン画像は明るさとして高い雲やヘイズを表わしているが、それらは大気中でメタン吸収の最も上にあるからである。木星はUVとメタンバンドでかなり暗いので、現代の技術でさえ、露出は長くしなければならないし、これらの画像は比較的低解像度である。対照的に、IR連続光やI-バンド(約740nm~1micron)での画像は、雲頂やわずかに深い所から反射された多くの光があって、赤味がかった模様は赤色光やIR光で明るい。 メタン画像でのEZとEB
通常はEZの幅の多くか全てを覆うメタンブライトなヘイズがあるが、その境界は可視光のEZとは完全には一致しないで、その外観はいくつかの大規模な変動に制御されている。 2007年に、濃い灰色-茶色のシェーディングがEZの多くを覆ったが、色が異なっていて、より通常はNEBsからのfestoonに関係して出現する青灰色の筋から拡がっているように思えるから、私はこれをその年の大変動に関係した着色現象として解釈した。実際、マルチスペクトル画像から、高高度ヘイズと一致して、EZはUVダークでメタンブライトであることが分かった。しかしながら、その灰色がかった茶色はより深い雲が晴れることが同時に起こることを示唆している。 2007年以降の漸進的変化は、2008年~2011年の一人の観測者によるメタン画像の例である、図2に見られる。2007年には、EZのほとんどはメタンブライトであった。2008年と2009年には、EZ(N)はヘイズレイヤーの崩壊が増加していることを示すように、メタンに鈍くなった。(暗いNEBsプロジェクションは、いつも視覚的に顕著ではなかったにも関わらずに、同様にメタンダークであった。過去何年も、これらの模様はメタンブライトなヘイズによって不明瞭である)。2010年には、EZ全体は通常よりはあまりメタンブライトではなかった。2011年には、パターンは逆転して、だからEZ(N)のストリップはメタンブライトで、残りの全ては鈍かった。EZ(N)は多くのメタンダークなストリークがあったけれども、このパターンは2012年も見られる。さらに、メタンブライトなEZ(N)は、意外にも全く一般的なように、視覚的に暗いNEBsに数度拡がっている(表1)。 このように新しいオレンジ色のEBは驚くほどメタンで非常に暗い。これは一様に暗くない。オレンジ色のヘイズ自体はメタン透過であるが、まるでストリークが非常にメタンダークであるように、最も暗い部分はEZのエッジに沿った青灰色のストリークと一致している。
紫外線(UV)画像は、予想通り、新しいオレンジ色のEBは特に暗く、眼視的に強く色がないセクターでさえかなりUVダークである。UVでのベルトの暗さの順序はおよそ次のようである。:
メタン画像でのNTB
NTBが目に見えて白化した2007年までの数年間は、メタンダークなNTBはずっと通常の緯度に存在していた。これはNTBsジェット気流とNTBnジェット気流の間のNTBの正規な緯度とおよそ一致し、このことは高高度ヘイズは主な雲レイヤーの気象変化よりは動的パターンによって制御されていることを示唆する。 2010年と2011年には、赤味がかったNTBが単に青白いストリップになるように淡化した時に、狭いメタンダークなNTB(S)が再出現した。しかし、まるでメタンブライトなヘイズがNTBの中央部を不明瞭にしたように、NTBは正規なNTB(S)よりはNTropZ(北緯23度)の青味がかったストリークと一致した。 2012年のNTB復活とともに、NTBの主要部は再びメタンダークになっている(北緯25-32度、表1)が、それにはミクロスケールのリフトによって今は眼視で明るく見える中央のストリップを含む。しかしながら、新しいオレンジ色のNTB(S)(北緯23-26度)はメタンダークなNTBsエッジ(北緯25度)と重なる。すなわち、NTB(S)の南部はメタンブライトであるが、北部はそうではない。これは2007年の同じ段階と一致していて、初期段階の新しい赤味がかったNTB(S)は必ずしもメタンブライトではないことを示している。この北エッジに沿って、メタン透過であるようにヘイズはかなり薄いか、または予想よりは深く位置している。我々は、2007-2008年に見られたように、今後数ヵ月のうちに完全にメタンブライトになることを期待している。 結論
全体的に、可視光とメタンの明るさとの間には強い相関はない。
| ||||||||||||||||||||||||||||||||||||||||||||||||||||||||||||||||||||||||||||||||||||||||||||||||||||||||||||||||||||||||||||||||||||||||||||||||||||||||||||
|
表1 紫外線(UV)、可視光、メタンバンドでのベルトエッジの緯度
木星地理緯度は、Gianluigi Adamoliによって、T. Akutsu, C. Go, D. Parker, M. Delcroix等(Pic du Midi)が撮影した、7月11日~8月10日の8枚のマルチスペクトル画像から測定された。また、F. WillemsとD. Peachによる可視光画像も測定された。いくつかの外れた数値は省略されている。青と紫外線画像は見分けられない結果で、一緒にグループ分けされている。 ボックスの@の数値は2つのピークを持つように見える。RGB画像のNEBsについて、低い緯度は長いダークストリークの南エッジを示す。紫外線と青画像について、エッジは非常に起伏がある。メタン画像のNEBsについての大きな分散は北緯約10~13度の真のバラツキを示す。
| ||||||||||||||||||||||||||||||||||||||||||||||||||||||||||||||||||||||||||||||||||||||||||||||||||||||||||||||||||||||||||||||||||||||||||||||||||||||||||||
|
図
Click to original size
Click to original size
Click to original size
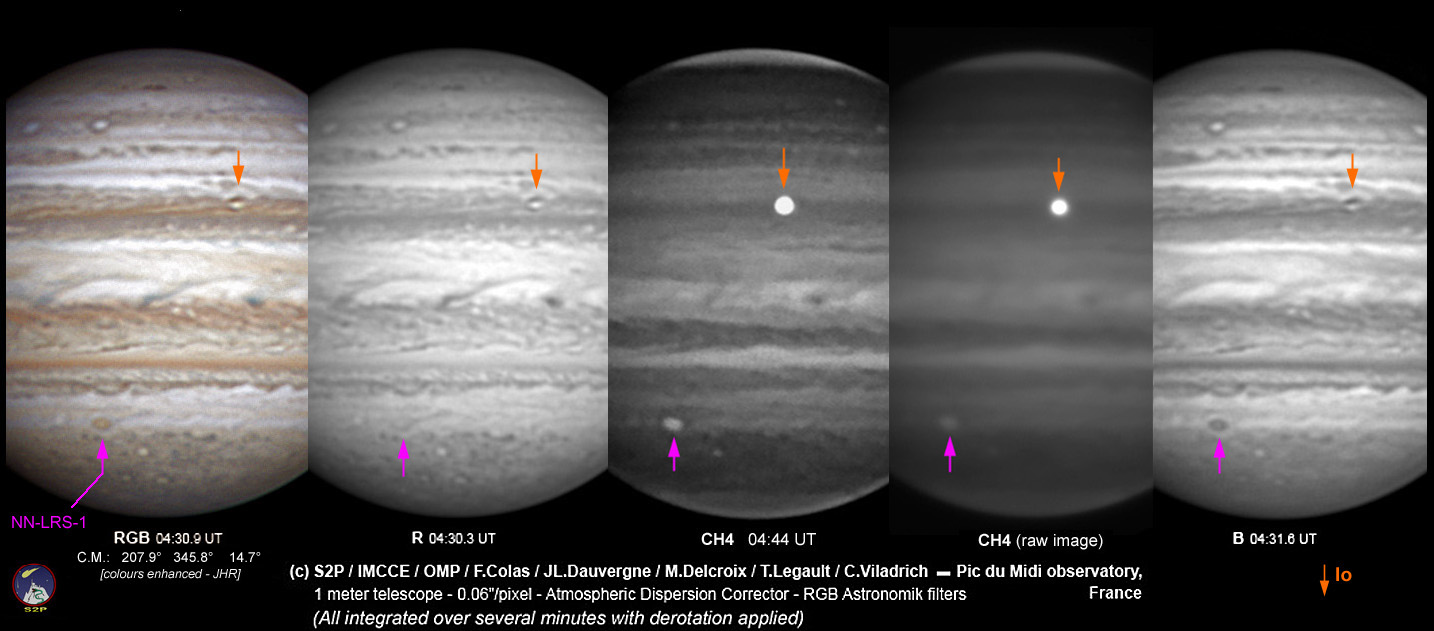
Click to original size Click to original size (a) 8月8日、(b) 8月10日(Damian Peachによるカラー画像とともに) 画像はシャープなので、相対的強度のより良い評価のために、生のメタンバンド画像(未強調)も含んでいる。
| ||||||||||||||||||||||||||||||||||||||||||||||||||||||||||||||||||||||||||||||||||||||||||||||||||||||||||||||||||||||||||||||||||||||||||||||||||||||||||||
|
John Rogers (British Astronomical Association), 2012 Sep.20 | ||||||||||||||||||||||||||||||||||||||||||||||||||||||||||||||||||||||||||||||||||||||||||||||||||||||||||||||||||||||||||||||||||||||||||||||||||||||||||||
|
_______________________________ 【日本語訳:伊賀祐一】 | ||||||||||||||||||||||||||||||||||||||||||||||||||||||||||||||||||||||||||||||||||||||||||||||||||||||||||||||||||||||||||||||||||||||||||||||||||||||||||||