| The colours of Jupiter in 2021 (3) Photometric spectra of individual features and regions by Christophe.P |
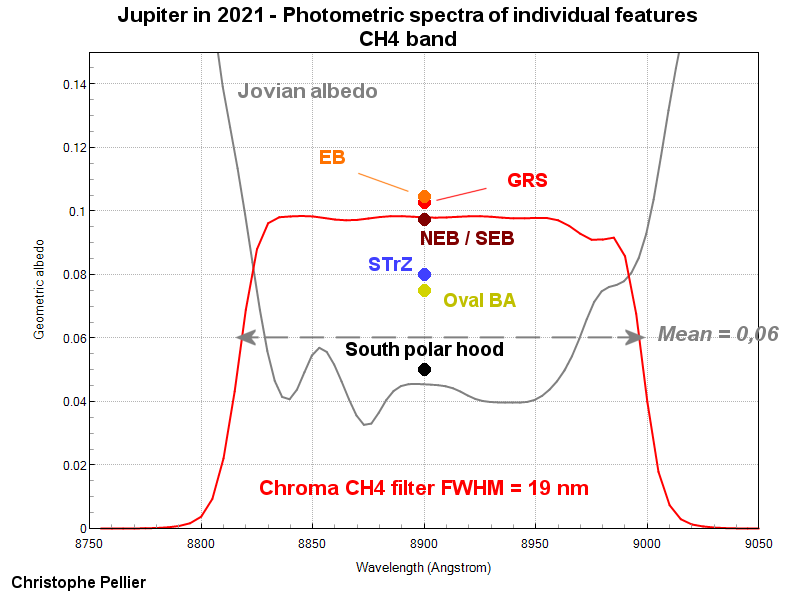
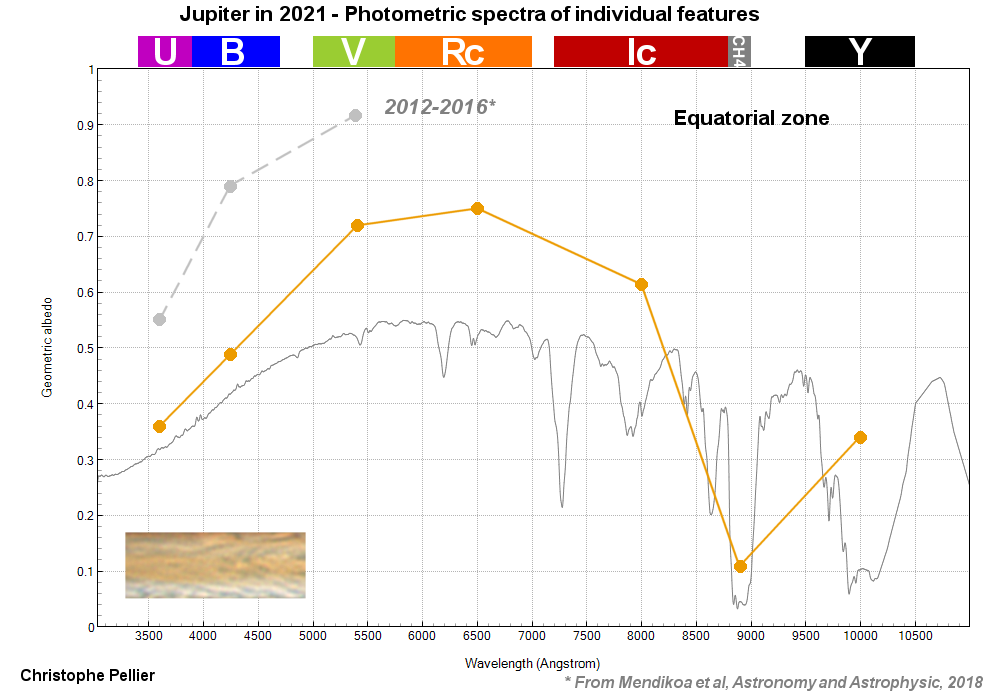
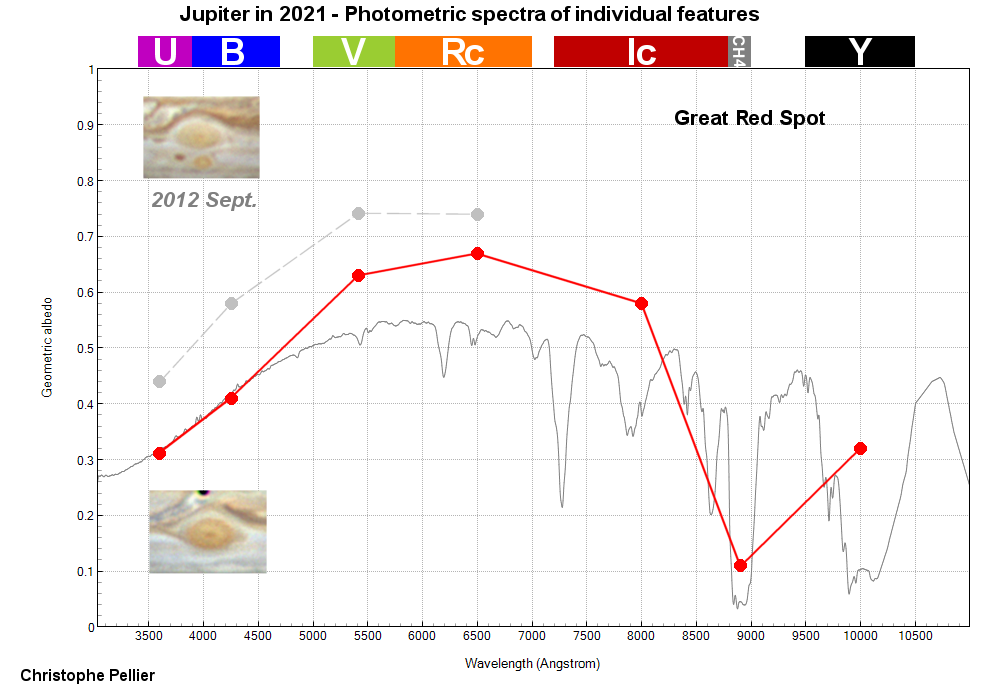
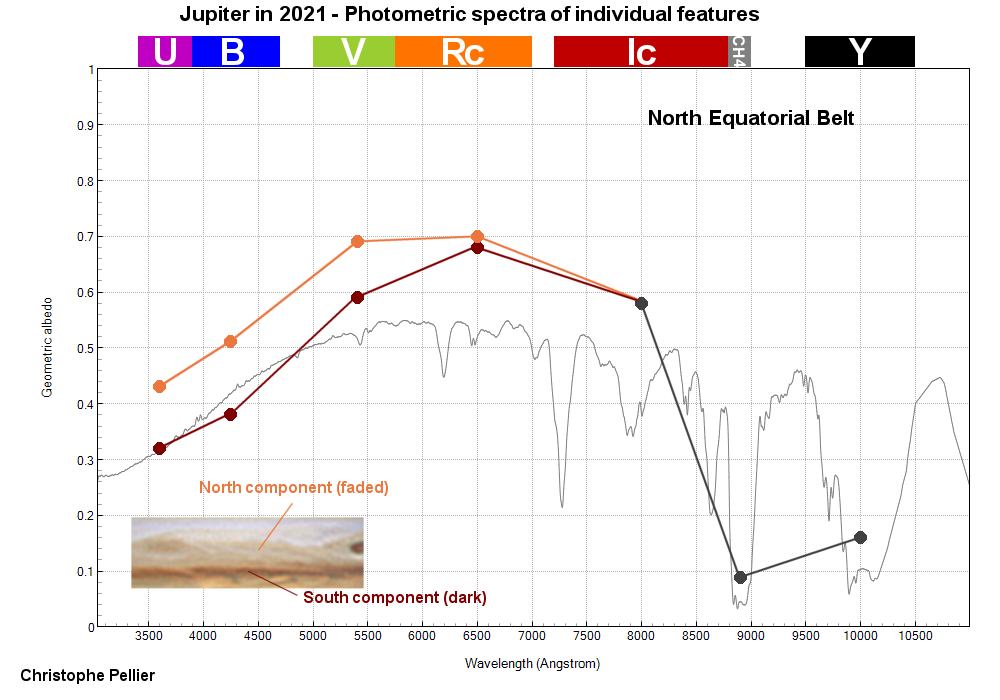
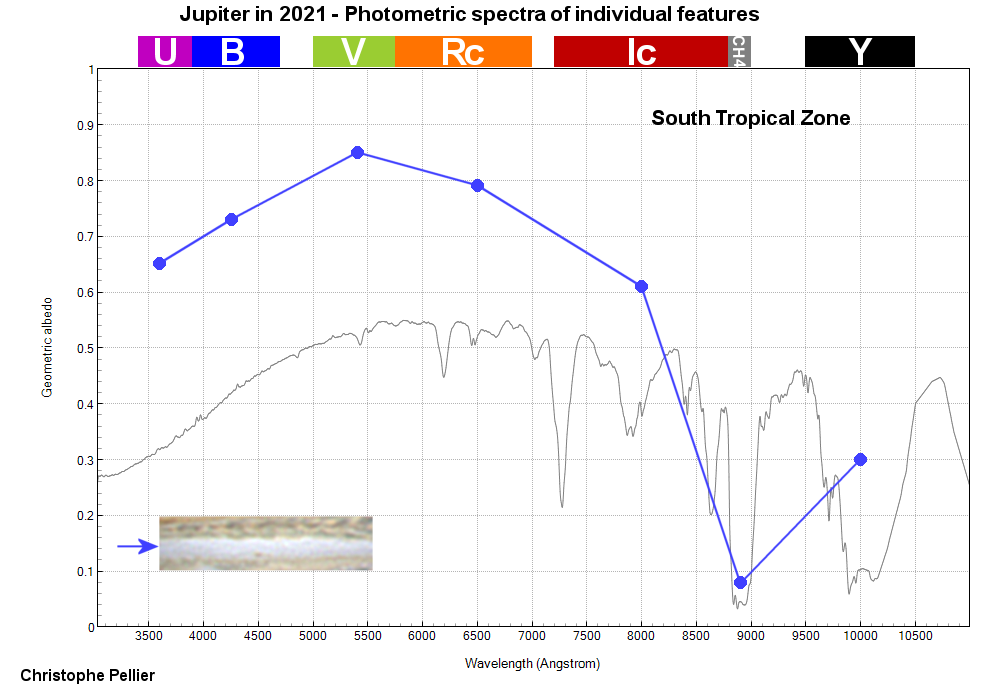
Here is the last topic from my study. North-South scans work wonderfully to measure the global state of the planet, but are not suited to measure individual features such as the GRS. In order to produce data about them, I have experimentated a second method, which is producing photometric spectra of some precise regions of the globe, equivalent to a spectroscopic analysis, but with only a few points. Values are simply found by measuring, when they are on the central meridian, the ratio of the brightness of the feature / the brightness of the whole globe, X the geometric albedo of the planet. Beofre that, the brightness of the individual feature is recalculated to find the brightness it would present, if it had the same geometric surface as the globe. By "brightness", I understand the intensity of the feature/globe measured on the photometric, unprocessed, image through a software (IRIS). This method does not only work for individual spots, but also for belts or zones providing that they present a rather homogeneous aspect throughout all the longitudes. For example, in 2021, it is possible to measure the difference in albedo/color of the two parts of the NEB. Because the absolute values measured inside the CH4 band are, by nature, very small in comparison with the other bands, I have made a specific graphic. The reason why most of the values look to be much brighter than the spectroscopic albedo from Karkoschka (grey profile), is simply because the value for the whole globe includes the light gradient from center to limb. Measuring features on the CM leads to much higher values, in general. As for any analysis, this way to produce results also suffers from limits: 1) It is less relevant for belts or zones that are not homogeneous throughout all the longitudes. For that reason, there is no graph for the SEB, for example. 2) Values are not corrected for the gradient of light between the equator and the poles. This means that it is only wise to compare date inside a given domain in latitude, but we should be careful when trying to compare values taken from different domains if they do not benefit from the same angle of illumination by the Sun. 3) Some measurements have been made when features where quite away from the central meridian. A coefficient has been measured to correct the data in this respect, considering that the photometric variation of the feature when turning from limb to CM was the same as its domain of origin ; but of course, in the reality, this might not be exactly the case. This could have led to errors, but I believe that they are reasonable. Finally, I have made a few attempt at measuring values from past apparitions, to compare, when features presented a widely different aspect. I present two that were quite obvious, but some of the results I have obtained in this respect were mixed. So take that with caution, of course. I hope to see some of you at the EPSC to discuss this, and many other things :)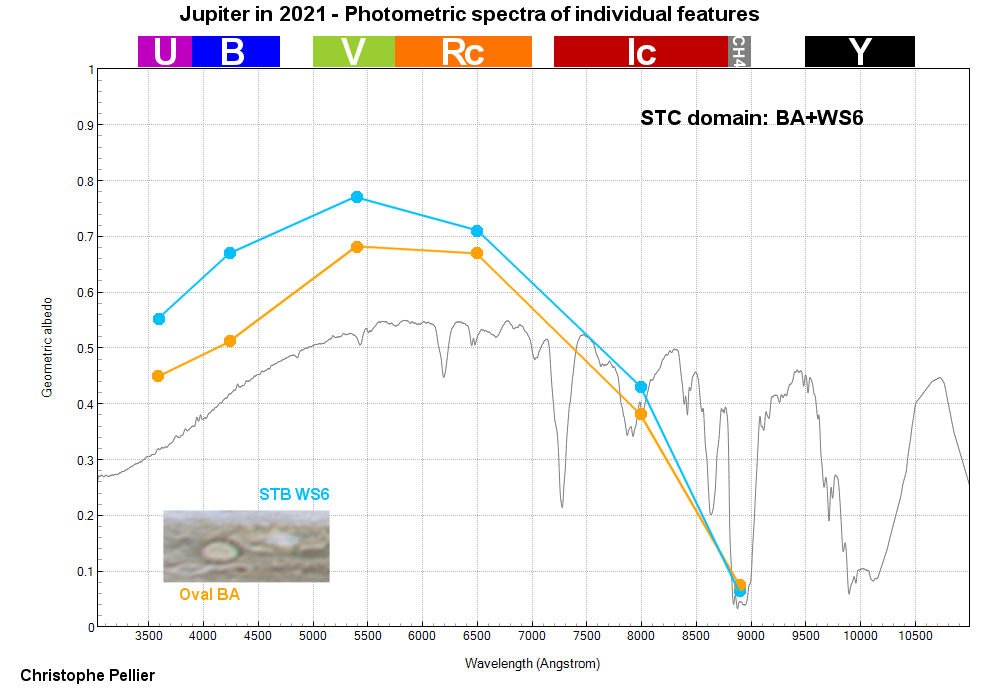
ALPO-Japan Latest